Most people in management positions today were brought up using traditional financial metrics to measure their team's performance. However, these metrics are no longer effective and let's be honest, they never were. There is too much focus on financial performance and external metrics, skipping past the essential metrics for managing your workforce and internal processes.
The information currently accessible for management teams do not actually provide a true understanding of the inner workings of the business and exactly what factors contribute to progress and success. Without the correct meeting metrics to measure, management teams are unable to make confident decisions when it comes to the internal functions of the business.
However, it's time for a change - management teams need new information and actionable data in order to take their company to the next level, and Flowtrace is setting the bar. In this article, we'll explore the reasons why management metrics are stuck in the past, and what Flowtrace is doing to revolutionize that.
The Problem With Metrics

The problem with management metrics is that they are often narrowly focused and rely on external and trailing metrics. They don't take into account all of the factors that contribute to a company's success or failure. Instead, they focus on an incomplete point of view, such as sales numbers or customer satisfaction rates. These are not wrong as per se, but they make it difficult to get an accurate picture of what's really going on within the company.
In addition, they are often trailing by the time they're released, and whilst they still might be correct, they are post-fact and cannot be relied upon to forecast the future. This means that they don't take into account changes that have occurred within the company since the data was collected. As we all know, nothing else is certain except the change.
Often, managers rely on these financial metrics to make decisions and gauge success, however, these only indicate past performance and are also often outdated at the time of action. Using Flowtrace data to understand internal processes can act as predictions for future performance and allow for more effective decision-making.
For example, taking the sales team into consideration, financial data could show that the sales team exceeded or hit their revenue targets for the quarter; however, internal data, such as a steep decline in external meetings booked by your sales team, could be a predictor for a decline in revenue for the upcoming quarter and warrant an immediate corrective action. This type of leading metric allows managers to act instinctively and immediately impact the performance of the team, which actually impacts results down the line.
With most management metrics being financial, Flowtrace promotes real time meeting metrics - where data and decision-making can actually have a profound effect on managers, teams, and company-wide performance.
Soft Metrics VS Hard Metrics
There are two types of management metrics: hard metrics and soft metrics.
Hard metrics are often used to measure the financial performance of a company. They include things like revenue, profit, loss, churn rates, and CAC. While these numbers are important, they don't give you an accurate picture of the inner workings of the business, but they are also lagging indicators that do not help managers predicting the future performance.
Soft metrics, on the other hand, are used to measure the non-financial aspects of the business. These include things like opinion-based surveys - such as customer satisfaction, employee satisfaction, and aggregated feedback. Soft metrics are often more accurate than hard metrics because they take into account the human element of the business. Flowtrace takes this a level further and collects team surveys in real-time, then plots trend lines as the business evolves.
Flowtrace's Solution
Flowtrace is changing the way companies think about management metrics and SaaS metrics. We're providing teams with the tools they need to measure the things that matter. Our platform gives you the ability to track all of the predictors that contribute to your company's success, in real time. This means that you'll always have accurate data that reflects the current state of your business.
We are the solution that compliments management metrics, in that we bring the internal meeting management metrics focused on the internal processes of a business, to combine them with traditional and financial metrics, giving managers a complete insight into organizational performance and workings.
In addition, Flowtrace is a meeting governance solution. We help you measure, and move your meeting culture where and when it matters, at the time of invite creation. This means that you'll never have to worry about your data becoming outdated, or team forgetting what matters. Let's take a look at some of the metrics that Flowtrace provides:
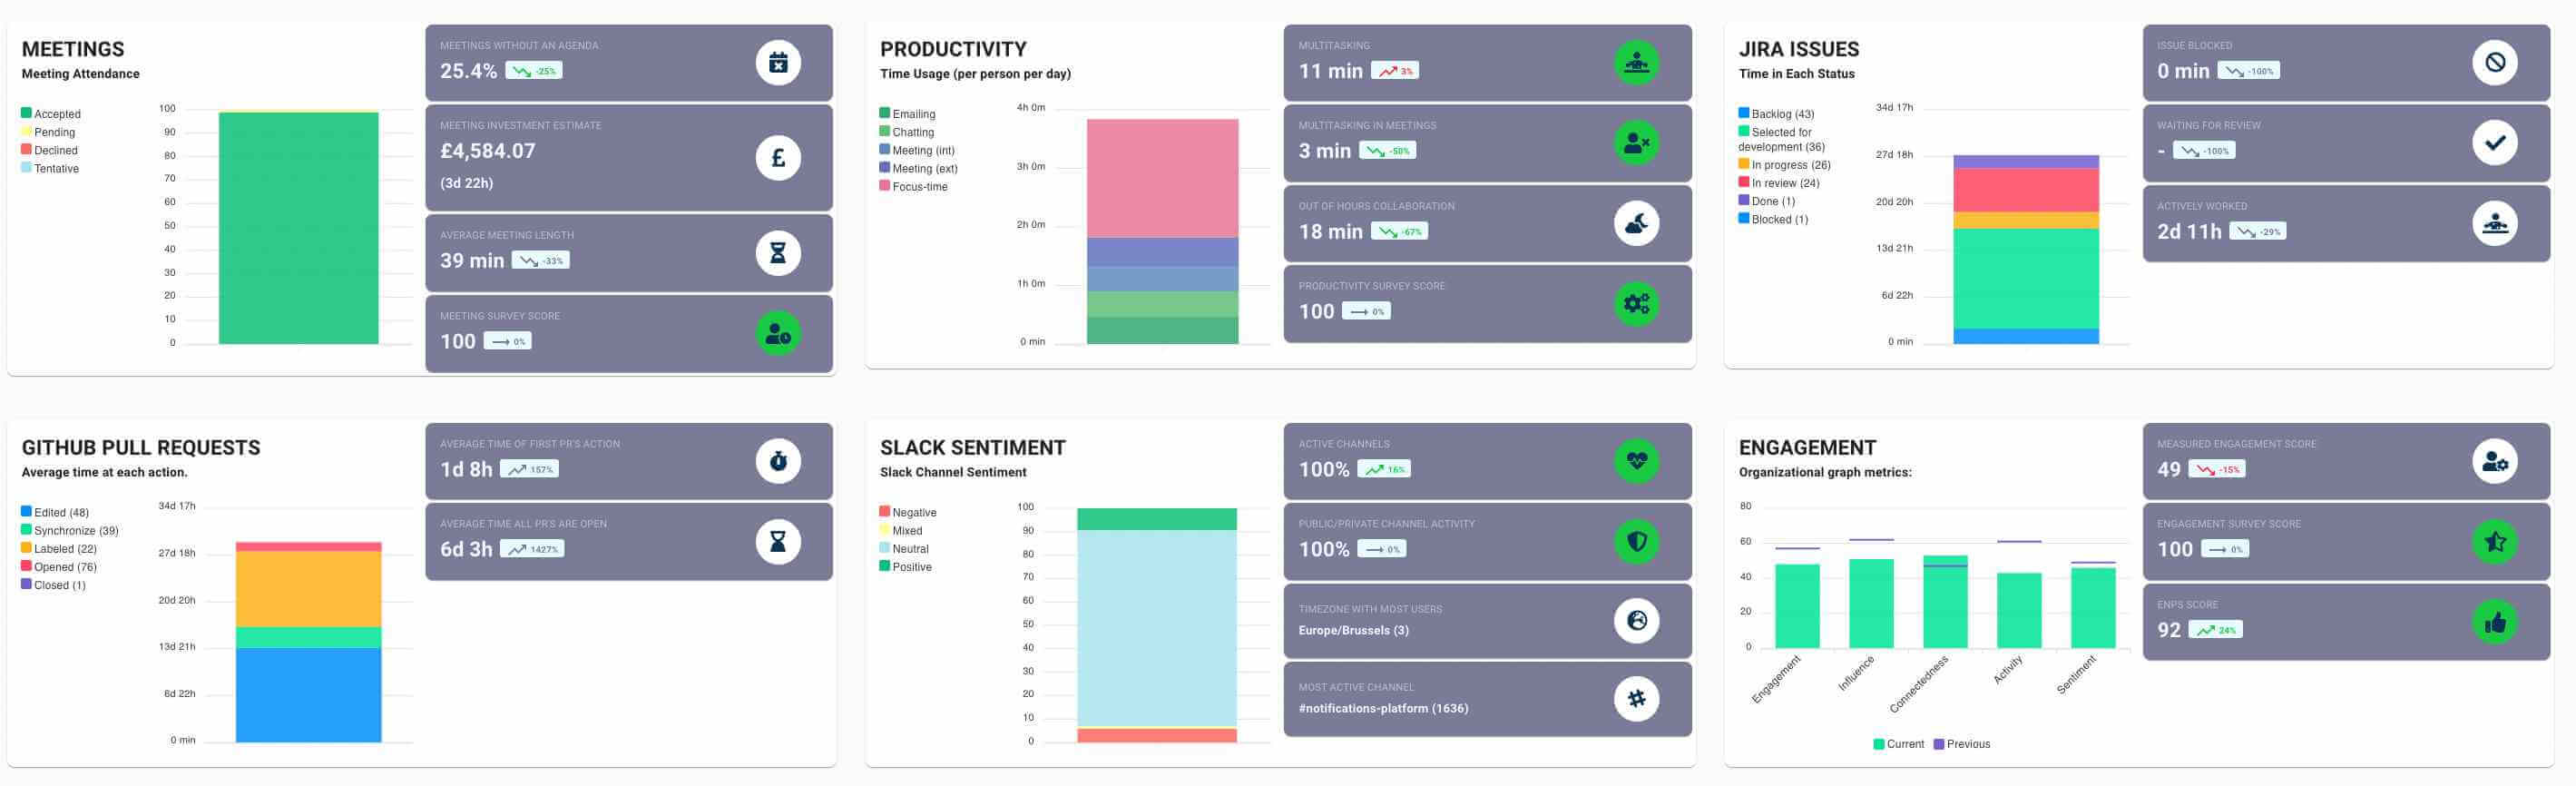
Meeting metrics:
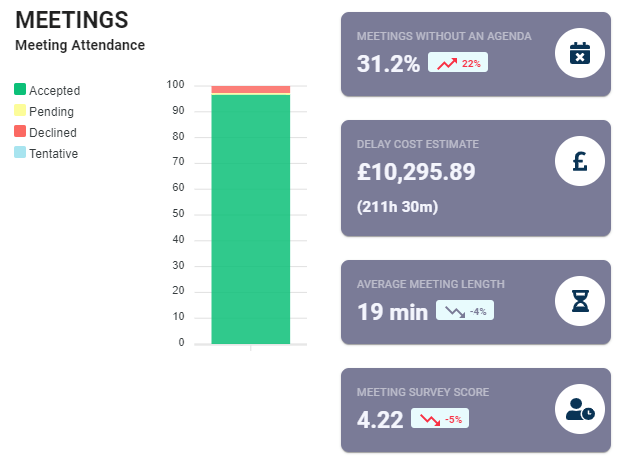
Meeting metrics measures the effectiveness of meetings. These take into account things like punctuality, cost of delays, agenda items, meeting length, and the number of attendees. This metric is designed to help you optimize your meeting structure and ensure that each meeting is productive.
We also provide insights into external meetings, which provide actionable data into sales meetings and to understand how the meetings are being scheduled, and conducted. These can be compared to previous weeks to identify trends and drops/increases in meetings.
Flowtrace displays meeting metrics for internal and external meetings, ensuring that managers can identify the resources that meetings use, how effective they are, and the performance of internal teams in the external environment.
Productivity Metrics
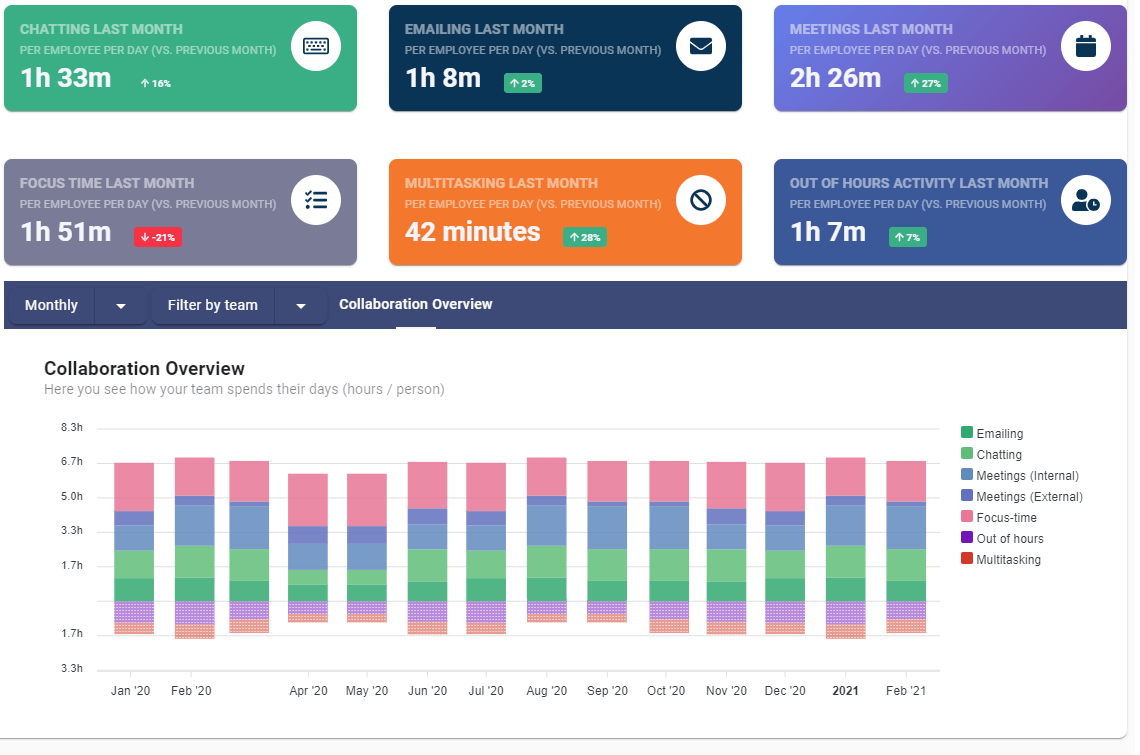
Productivity metrics measure the environment you have created for your teams. They take into account things like task completion, time spent multitasking, deep work time, and out-of-hours activity, and project deadlines. They also cover cycle times for your core teams including customer success, engineering, product, and sales.
Negative aspects impacting productivity, captured via metrics such as multitasking - can identify areas of disruption or meeting overload, out-of-hours activity - which can be linked to burnout, lower performance, and too high workload. Collaboration, including meeting time - which can help identify where there are too many meetings taking place, for example, a high number of meeting minutes combined with a high number for out of hours work, could demonstrate that teams don’t have enough time to get their work complete.
Another vital metric tracked here is focus time. This is how much time teams get for uninterrupted work where they can drill down and get the important work done. If the metrics are showing that focus time is very low, this can have a wider impact on productivity.
These metrics are designed to help you identify areas where your team can improve their productivity.
Collaboration Metrics
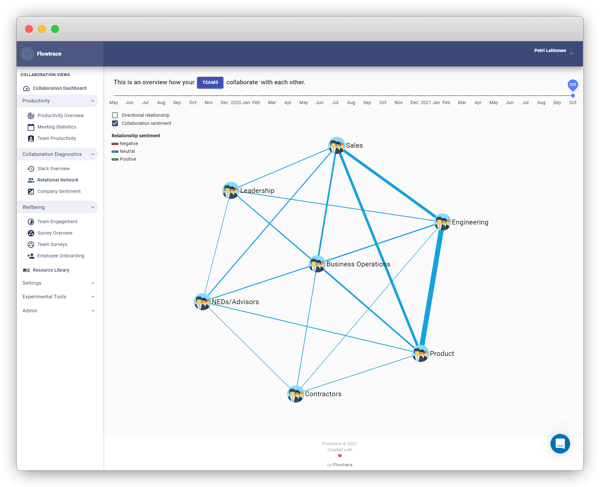
`These metrics measure the collaboration of your team and takes into account things like the number of meetings, number of project conversations, and number of co-authored documents. Collaboration metrics are designed to help you identify areas where your teams are isolated and siloed. Silos are one of the leading causes of ineffective work in startups and can cause company failures.
You can drill into areas in Slack where communication is missing between select teams and where it is strongest, see where file links are being shared between teams, and see a collaboration activity breakdown by the hour.
These metrics allow managers to identify and improve inter-team collaboration and improve cross-functional relationships. Proactively designing the cross-team collaboration has never been easier.
Why These Metrics Matter
A company is only as good as its team, and unfortunately, management metrics until now have only focused on the performance of the business, not the team, which is the driving force of your business. By using these meeting metrics, management teams can understand the inner workings of the company and make informed decisions that will affect the performance of the business directly.
It Doesn't Stop There
Flowtrace doesn't just provide accurate and beneficial data, it also provides tailored recommendations to improve selected meeting metrics. These rules you can configure will provide steps to all employees. We also show the cost of the meetings, so everyone in your team understands that "time is money".
.png?width=960&height=540&name=Marketing%20Images%20(11).png)
Conclusion
With access to these game-changing meeting metrics, management teams are now able to make informed decisions and gain a better understanding of the inner workings of the company. If that's not enough, Flowtrace also provides recommendations for managers to action and start improving meeting culture that will ultimately contribute to a better-functioning business.