Analytics & Metrics
Jira Analytics for Engineering Teams
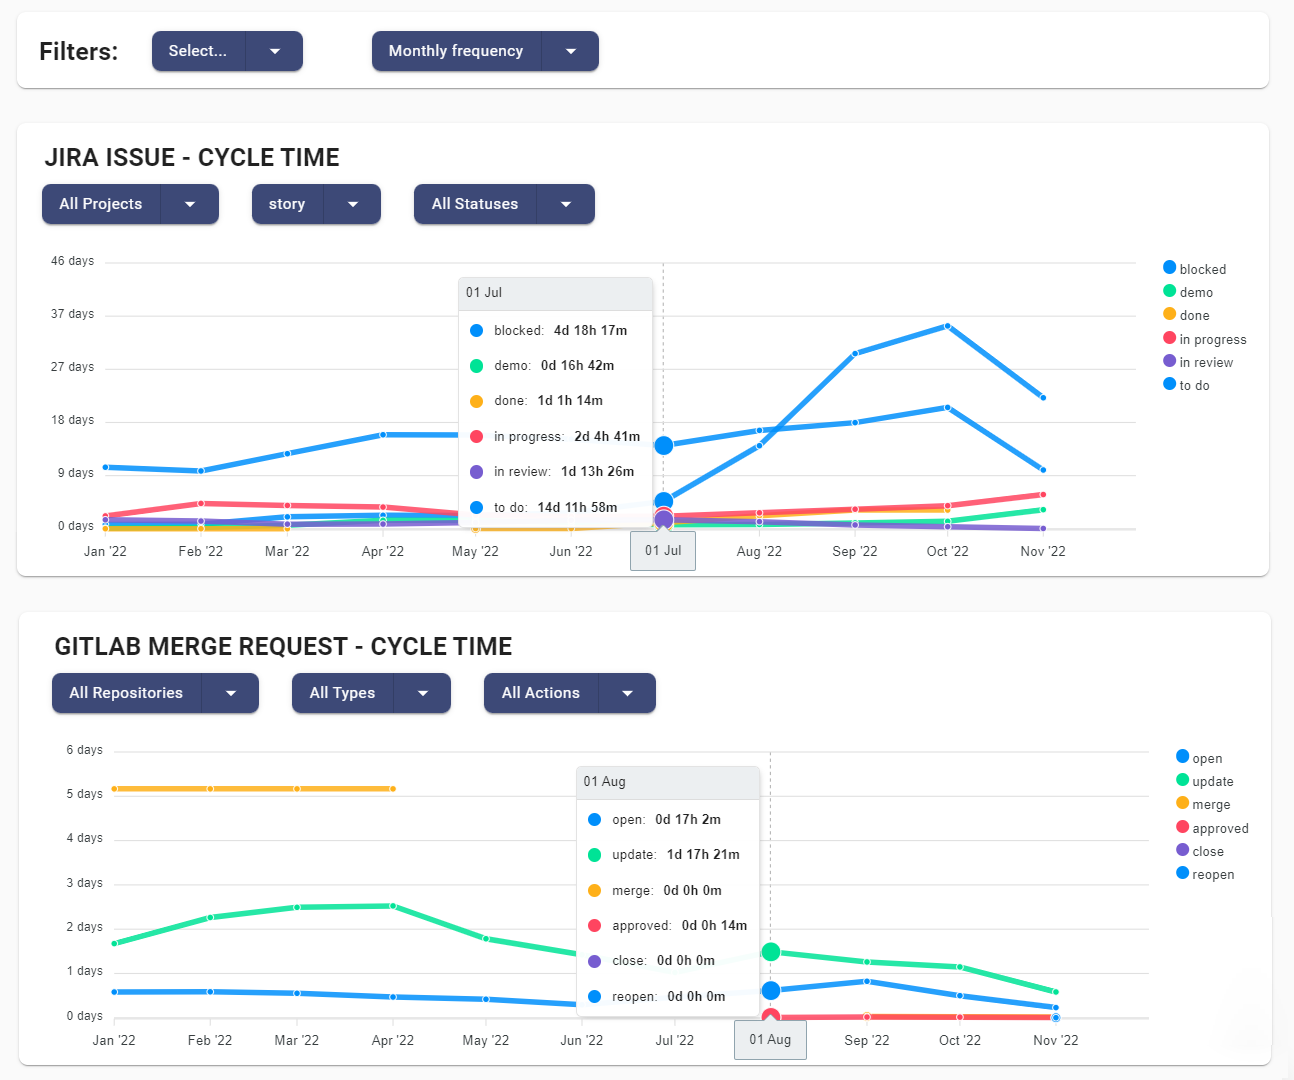
Jira analytics provides real-time intelligence for engineering teams. Our native integration allows you to explore insights with a 360-degree...
Company analytics provides you with insights to understand inner workings of your business. This enables you to take data-driven decisions for improvement.
As a business, it is essential to measure your company's performance. Company analytics can be used in order to make sound decisions about the internal workings of your business. There are a number of different internal tools and business intelligence platforms that can help you do this, but they are time consuming and expensive.
Fortunately, there are out-of-box options available that can provide you with the data you need to understand and measure your company's internal working and how effective your processes are. All your productivity and collaboration tools integrate seamlessly with company analytics plafroms like Flowtrace, in order to make data-driven decisions without the need of internal data analytics team.
Company analytics refers to the quantitative and qualitative analysis of data that is collected to understand the inner workings of your company including functional boundaries, information flow, daily processes and team performance. This data can be used to track progress, identify areas of improvement, and make data-driven decisions.
This could specifically focus on teamwork, communication, collaboration, engagement, and other cycle time-type of metrics that allow you to understand exactly how teams function on a high level.
Analyzing the data for various platforms, insights allows you to focus on bottlenecks and identify process areas that need improvement across the company. This could be focusing on throughput, punctuality, information silos, meeting culture, and communication channel effectiveness as an example.
When using analytics for decision-making, the data that is collected must be processed and analyzed correctly to make informed decisions. This should also respect employees' right to privacy in the process. The use of data analytics platforms can help with this, as they provide the tools and features, but they are not always easy to analyze or make sense of, which is where Flowtrace steps in.
It is important that you look for patterns and trends in the data in order to identify the core of any underlying issues without making assumptions or incorrect decisions. An effective decision intelligence strategy would be useful to follow here.
There are a number of benefits to measuring company business analytics that allow you to make data-driven decisions and improve on certain areas, including:
Company analytics can help you to make data-driven decisions that are based on facts and evidence. This is opposed to making decisions based on assumptions or gut feelings, which can often lead to biased and sometimes, completely incorrect decisions.
Identifying areas of improvement is another key benefit of company analytics. This data can help you to pinpoint areas that need attention so that you can focus your time and efforts on addressing the issues present in these functional areas.
Setting up goals which are measurable, and following your company's progress is essential to ensure that you are on track to achieve your goals. It is essential you have the tools to follow the progress of the goals you set to achieve.
With company analytics, it usually takes mere days to weeks to see the results of any process, team, or policy decision, and to verify the results and trends are according to the expected outcomes.
Since the team is the core unit of any company, it's important to have a clear understanding of how your team is performing. More importantly, a data-driven team is necessary when working to improve employee productivity through efficiency and effectiveness.
There are a number of ways to understand team data including visualizing how the team uses their collaboration tools, understanding how interactions between teams take place and analyzing the context where information sharing takes place.
There are a number of metrics that you can track for teams, but the most important ones are:
Productivity is a measure of how much work is being done by your team. This can be tracked by looking at the number of tasks completed, the number of hours worked, or the amount of work produced.
Quality of work is a measure of the quality of the work that your team is producing. This can be tracked by looking at customer satisfaction ratings, error rates, or rework rates.
Engagement can be measured based on facts and data (Which Flowtrace does) or based on assumptions with no evidence to back them up. An ideal method of measuring engagement also comes through surveys that gather feedback on topics and work.
We have broken down the type of company analytics to two parts, one covering the common analytics across every team, and the other part to the analytics across the functional process tools.
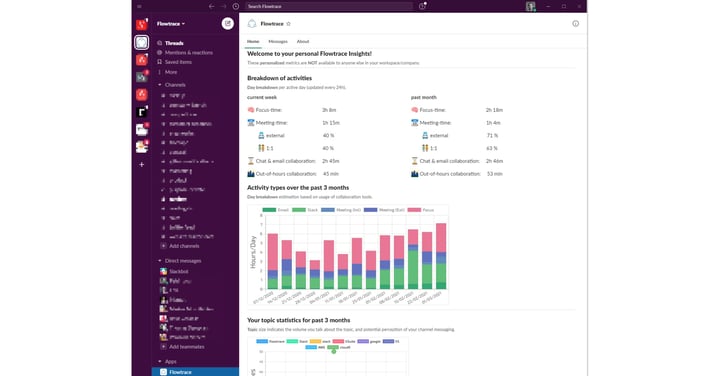
Slack is a powerful communication tool, but it can be difficult to get actionable insights from the data that it generates. Flowtrace can help you to understand your Slack data and creates advanced Slack insights that you can use to improve your team's productivity, engagement, and retention.
There are a few common areas that companies focus on when using Slack analytics:
Channel Relationships - This looks into your public channels, and who participates in those conversations. This can generate a metadata analysis, to get an accurate image of how your channels relate to each other. The data allows you to measure information flow and bottlenecks between teams and topics.
Company Topic Analytics - To understand the topics your company talks about and reveal insights on the hot topics, topics that are a struggle, and those that the team is not happy to work with.
Team Relationships - Helps to understand your team's collaboration patterns within a team, and across the teams. How the collaboration takes place, and how the interactions relate to each other.
Company and Channel Sentiment - Captures the sentiment of the messages exchanged on public channels and authorized private channels. Allows you to understand the trends of the conversation.
Communication channels: Which channels are being used most often, and for what purpose. Allows you to streamline communication for effective channels only.
Team productivity: Are teams using Slack to work together more effectively? Identify participation and inter-team relationships.
Flowtrace can help you integrate this data and provide actionable solutions for your company using these analytics for decision-making and problem-solving.
Google Workspace (formerly G Suite) is a powerful set of tools, but it can be difficult to get actionable insights from the data that it generates. Flowtrace can help you to understand your Google Workspace data and get insights that can be used to improve your knowledge sharing and collaboration across teams.
There are a few common areas that companies focus on when using Google Workspace analytics:
Find out more about how Flowtrace can help you integrate and analyze this data easier.
Google Calendar is a powerful tool, but it can be difficult to get actionable insights from the vast amounts of data that it contains. Flowtrace can help you to understand your Google Calendar data that can then be used to optimize your team's meeting habits, punctuality and quality of decision making.
There are a few common areas that companies focus on when using Google Calendar analytics:
Get started with Flowtrace today to see how we can help you get insights from your Google Calendar data.

In addition to the above, there are also functional tools that fall under company analytics. These help to optimize different areas within a company and can be used to track progress or measure impact. To access these tools individually would be time-consuming and discouraging to align the data for each; that’s why high-level metrics and KPIs are aggregated to company analytics in tools like Flowtrace.
The company data that is available to you can be utilized in two different aspects:
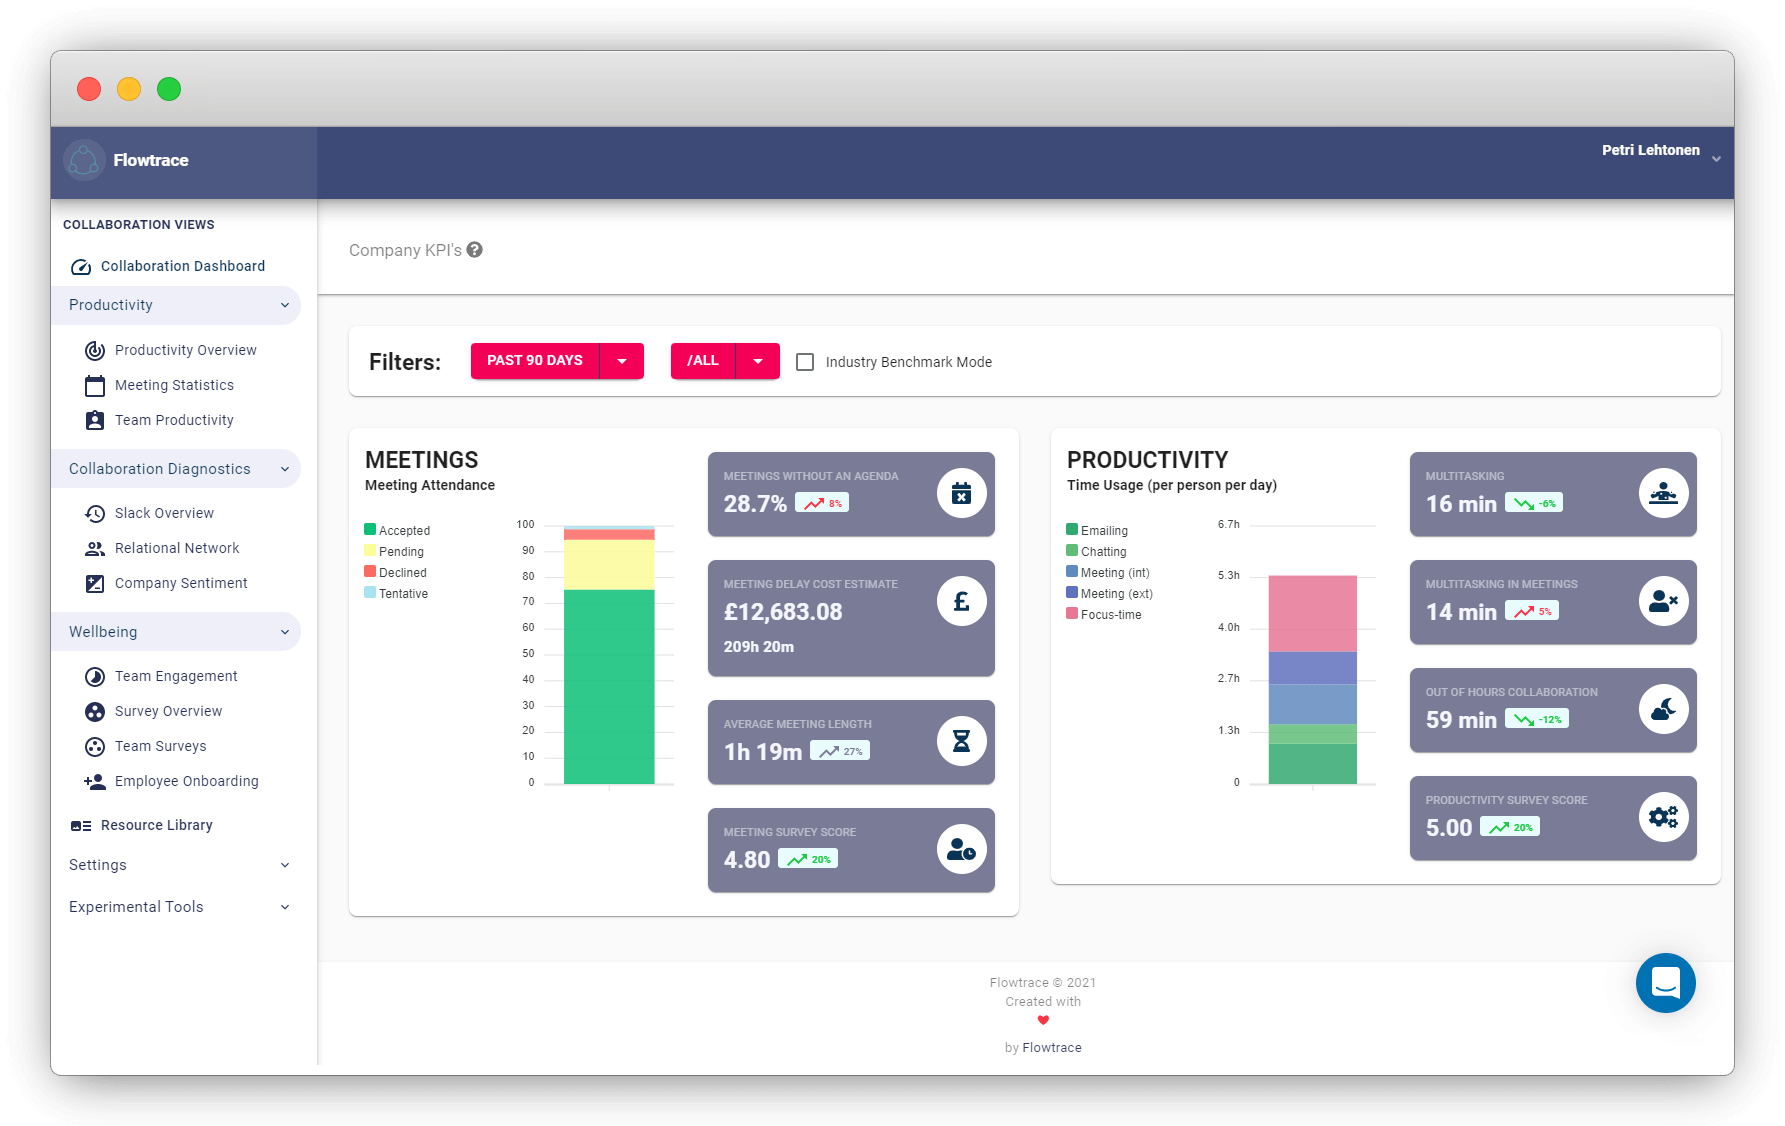
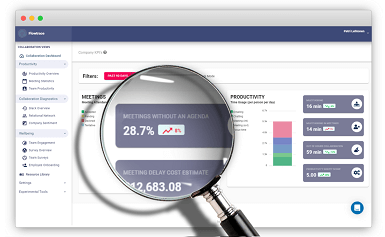
Common analytics for all teams focuses on the aspects of meeting culture, collaboration effectiveness, and inter-team relationships. They can help to identify bottlenecks, resolve issues before they arise, and streamline team performance as a whole. This can include:
Here you can gain insights into your meeting culture. This will allow you to tackle meeting fatigue, identify ineffective meetings, and identify any collaborative decision-making issues. This can be further narrowed down into understanding meetings without agendas and feedback.
You can identify where relationships within your team experience issues or fail to exist at all. This will allow you to identify any gaps in company processes, breakdown of information silos, poor work handovers, and ineffective communication channels.
You can discover communication channels that are ineffective and those that are effective, which channels receive the most engagement, focus topics of the company, and streamline processes.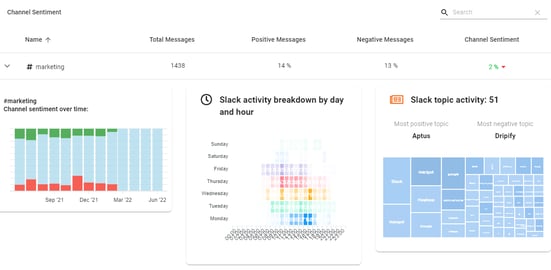
Understand how your team is collaborating through docs, with the use of comments, link sharing, and documents with no activity.
There are many different ways to use team analytics for your company. By using analytics to make data-driven decisions, you can streamline processes and empower teams to perform at a higher level.
Every team has different functions, requirements, deliverables, and circumstances, it is important to measure and identify analytics on a team-based level too. This could be looking at:
How does the best sales team compare to the lowest-performing team when it comes to deal progression and teamwork across the deals? Same cycle time metrics which apply to nearly all functional tools applyes to sales deal flow stages progresssing through appointment scheduled, qualified to buy, contract sent, and deal won.
Using company analytics to drive team improvement is easy when you have all the core analytics available. It's beneficial to consider team performance as a construct of common things like communication, meeting habits, transparency, and information sharing, which is captured by analytics from common tools of Google Workspace/Slack.
When you complement this information with high-level usage across the functional tools like GitHub/Jira/Hubspot, you have a good view and basis to drive team improvements.
There are many angles to the company analytics that can be used to measure team performance. By understanding the different types of data that are available, you can more effectively apply them to your team and use them to improve punctuality, productivity, and collaboration.
Flowtrace offers a suite of tools that can help you to collect, analyze, and visualize your data. Get started today to see how we can help you get insights from your data.

Jira analytics provides real-time intelligence for engineering teams. Our native integration allows you to explore insights with a 360-degree...
We integrated GitHub analytics into out decision intelligence platform. Use us to reveal hidden cross-team dependencies and resolve bottlenecks.
Are you looking to optimize your process cycle time and drive business success? Our platform allows you to identify bottlenecks and inefficiencies.