Flowtrace Jira analytics provides business intelligence and real-time data analytics for engineering teams. Our platform is integrated natively with Jira accounts, enabling you to create, modify, and explore engineering team data from a 360-degree perspective. This powerful tool is fully customizable to your company's needs and requires a one-minute installation. To get started, visit the Flowtrace pricing page and select the plan with Jira Analytics included.

Flowtrace Jira Analytics incorporates reporting on various metrics across different projects, boards, and combines it with all the collaboration tools, and productivity tools your team uses. The Jira reporting options available include cycle-times, trend correlation with GitHub and GitLab cycle-time metrics, and the trends over time.
In this blog post we outline the common benefits of Jira analytics within the engineering teams:
- Holistic metrics across the engineering process'
- Delivery bottleneck analytics and delay insights across your development workflow
- Cross-team collaboration insights for your engineering teams
Flowtrace platform
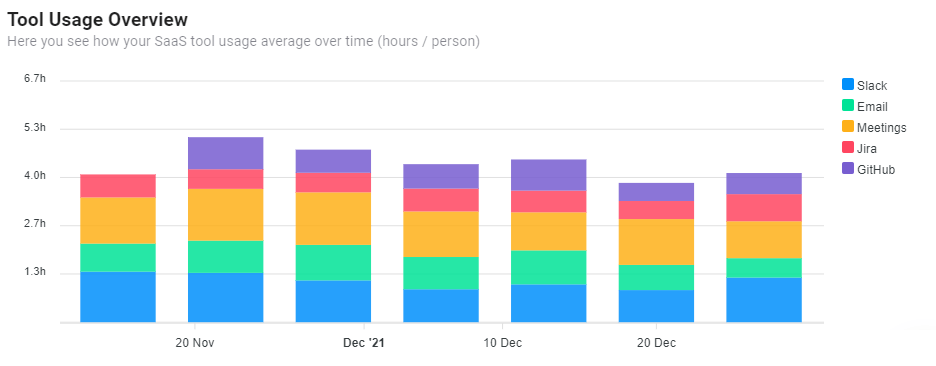
We combine Jira analytics deep into the collaboration insights we surface in our platform. Every analytics view can be filtered with common Flowtrace parameters of dates, rolling periods, and teams. Here's an example of how SaaS tool activity time trends in a deep-tech company of 30 employees.
How to configure Flowtrace Jira analytics?
The best part about Flowtrace's new Jira analytics capabilities is that it is included for free in our scale plans. First, go to the Flowtrace integration page, and copy your unique Jira integration account webhook URL to use.
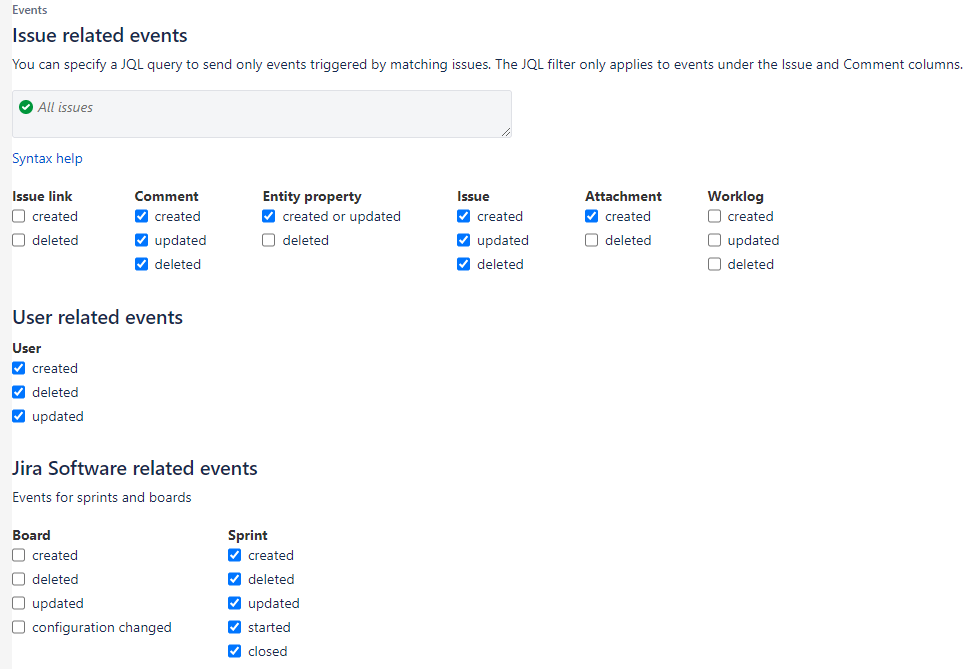
After this, all you need to do is log in to Jira, and find your way to Webhook configuration. From there you select an issue type or project you want to be included. You can leave the filter empty to default to all projects and issues. Following from there, you can select the desired event details and other data you want us to analyze. You can customize this by removing or adding event fields to accommodate your internal workflows and features used in Jira.
The reports generated by Jira are account-specific and we display only issues that match the filters for the selected board you control. The dashboards are displayed on a screen with several options: issue types, comments, updates, users, and specific Jira, or Confluence events. This way you have complete control over what information Flowtrace Jira analytics has access to. With these tools, you can make informed decisions and work smarter.
Why use Flowtrace Jira Analytics?
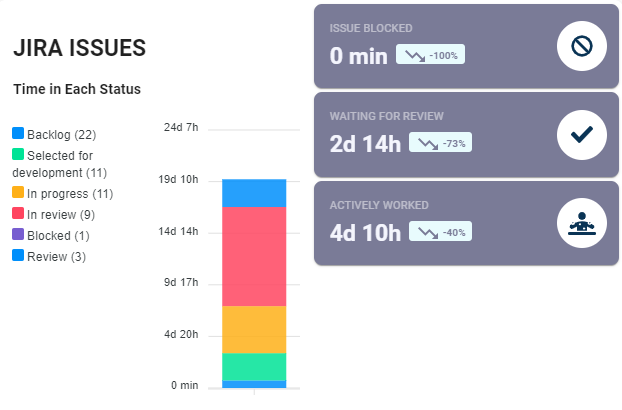
Jira Analytics can provide detailed information about the status of a project. In addition to comparing the overall project's progress with its goals, it can also identify problems and opportunities for improvement. Our insights make it easy for you to improve the quality of your project delivery, and the way your team collaborate across the teams. We display issues' age, type, and resolution times, and the time it took them to close them. This is all out of the box.
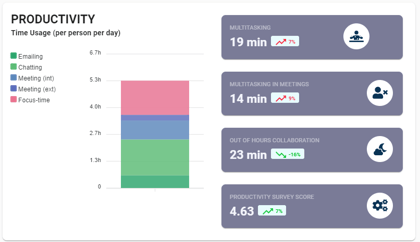
In addition to analyzing and presenting insightful data, Flowtrace Jira Analytics can help you make better business decisions. The Dashboards allow you to see how the different projects are progressing in each team and department. Every meaningful action your team takes in Jira, is taken into account by our productivity metric calculations. You can even compare the progress of the different projects and teams. For instance, a particular project may be more complex than others, and the internal collaboration and alignment requires more time compared to other aspects of your engineering processes. A dashboard that displays the average focus-time across the teams, and projects, will give you a tangible way to improve, and a factual estimation of the delivery from your teams.
Depending on your needs, you can even customize reports to keep your teams up-to-date with built-in Slack reporting. Using Jira analytics, you can analyze trends in multiple metrics to make informed decisions about your organization's engineering performance. For example, you can analyze the time it takes your team to deliver a new feature and how any bottlenecks in the code review process impacts feature delivery. By presenting this information directly to your employees on a weekly basis enables the team to take ownership of their delivery bottlenecks.
Jira Analytics meets Flowtrace metrics
The dashboards provide a comprehensive overview of a teams' progress. You can analyze sprint performance over time, and compare it with other teams. You can also see the results of different actions your teams take. The dashboards provide a complete view of the current state of the processes of your teams. We combine all Jira analytics with our built-in collaboration analytics:
You can see which team is working best on a particular task and which is the most efficient. You can analyze the performance of the entire team with the help of Jira Analytics.
Decission intelligence tools like Flowtrace can be useful for tracking real-time data in engineer processes. You can view the health of your teams by overlaying the core metrics, and dashboards across the tools used on daily basis.
We are certain your teams will benefit from root cause analysis of holistic engineering processes powered by Flowtrace!
What are you waiting for? Take our Jira analytics into a test spin by selecting a plan suitable for you!