Meetings
Enhancing Scrum Ceremonies with Meeting Metrics
Learn more about Scrum ceremonies and how meeting metrics can improve them.
Internal metrics are currently led by lagging indicators and do not work - it's time for a new set of management metrics to take businesses to the future.
Having access to management metrics that look at the internal processes of a business is vital when it comes to making informed decisions and predicting future outcomes. They allow managers to understand business performance at a companty, department, and team level from within, and when linked with external and financial metrics, it creates a complete predictor of performance. We will have a look at the different management metrics that Flowtrace produces for internal functions.
Currently, managers often rely on activity-based metrics, in addition to other trailing metrics. Unfortunately, these lagging indicators, whilst they might be correct, do not create an accurate picture of value delivery in the present, nor are they reliable for future performance prediction across the business. As the core internal teams are responsible for these results, why aren't there metrics that break down and understand team performance?
When leading a team you need to be able to identify how your team is functioning and how well internal processes are working. This helps when it comes to identifying team bottlenecks, low-performing teams, and systematic process issues that may occur within teams.


Flowtrace covers a range of different management metrics for internal processes, each of which looks at different areas such as productivity, collaboration, engagement, and meetings. Let's have a look in more detail:
When it comes to the product development teams, managers need to understand some key metrics in order to see how progress is coming along, any potential underlying issues, and also in order to coordinate with other team functions. Flowtrace looks at:
Internal meetings: These show data for the number of meetings, time spent in meetings, punctuality scores, meeting feedback, and meetings without an agenda. It also shows the financial implications of late meetings. This can help managers structure meetings, optimize timings, and improve budgets.
Cross-team collaboration metrics: This looks at how teams interact with each other, essential when product teams need input from engineering, and marketing needs input from the product team, etc. Data will show which teams interact with each other through relationship maps, documents sent and shared, Slack channel breakdown, and topic sentiment. This enables you to break down organizational silos by identifying where barriers to information may be occurring.
 Project management cycle times: The key metrics relevant to product teams are the issue lifecycle, like 'issue open" and "issue in review". This allows managers to see how effectively issues are resolved for product delivery. For example, a large number of issues in review for a long time and a low number of worked on could indicate issues with communication, access to tools, staff, and many other areas.
Looking at management metrics in this instance can be vital in assessing predictors for future revenue drops and performance. For example, if external meetings drop for sales teams, a drop in revenue could occur at a later date. Flowtrace looks at:
External meetings: This can assess the number of meeting minutes booked externally by the team, which can help to understand potential revenue increments, and not hitting targets. This metric is highly correlated with sales pipeline progression.
Cross-team meetings: This looks into the collaboration aspects of teams, which is vital for passing on information, brainstorming, and teams are well-functioning and can be dependent on one another for productivity.
Deal cycle times: This looks at how long it takes to progress the deal stages until the deal is closed. It can identify issues with passing on information through teams to get deals signed. This can pick up issues in communication, inter-team relationships, tool usage, multitasking, and more. It could be something as simple as potential clients being sent a contract file by email to sign, and the team forgetting to follow up. Correlating the success in deal stage with internal activity reveals what is required for further pipeline progression.
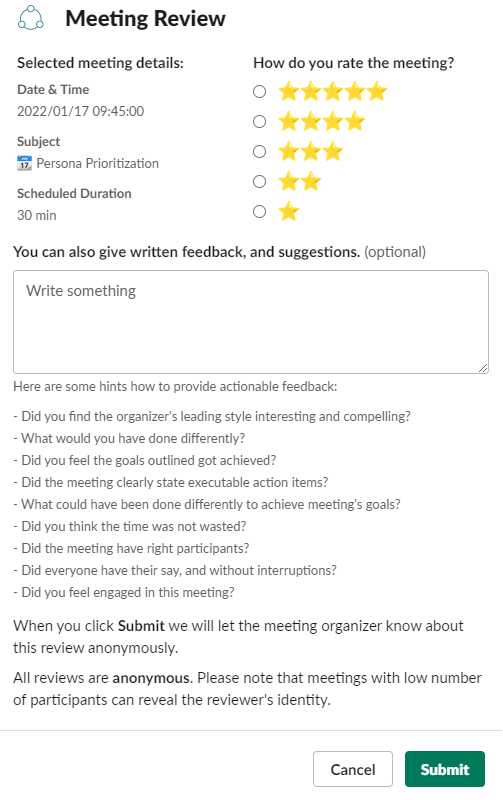
Understanding meeting metrics is an essential part of management metrics. Meetings are used to pass on vital information, set goals, update teams, encourage and motivate, and more. It can also be an indicator of teams lacking focus time and too many meetings being scheduled. Flowtrace looks at:
Agendaless meetings: This looks at how many meetings were conducted without an agenda. A common indicator of meetings that extend for longer periods of time and miss vital information as they don't follow a structure.
Punctuality: Late meetings can cost the company thousands, or even millions depending on the size of the team. They also cause disruptions throughout the teams involved. Understanding trends in punctuality can help managers find better structure and planning, and save the company money.
Time in meetings: This can identify how long was spent in meetings for different teams. If, for example, one team spent 50% more time in meetings over a month but also had high multitasking and out of hours working, it could be an indicator that they don't have enough time to complete work due to being in meetings.
Meeting Costs: Meetings cost money, especially late or extended meetings due to having no agenda. This metric allows managers to keep costs down and identify areas of meetings that are causing high expenses.
Outputs from the engineering team can impact all other teams and the business in many ways, understanding various metrics related to code reviews and cycle times can help you identify bottlenecks, efficiency, and even burnout. Flowtrace looks at:
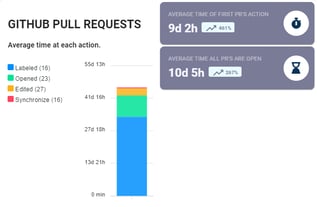 Code review cycle times: This includes tools such as GitHub and Gitlab. It takes a look at pull requests and the average time spend on each activity involved. It allows managers to understand bottlenecks in the teams, complexities of projects, tool overall usage, and how to optimize the delivery lifecycle.
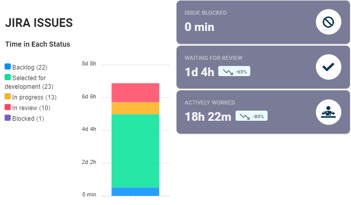
Product management cycle times: This covers tools such as Jira. This breaks down Jira issues and time spent in each status. It looks at issues that in backlog, in review, blocked, currently worked on, and more. This allows managers to identify any issues with workflow, processes, collaboration, tool effectiveness, and other potential areas that may hinder output in resolving Jira issues.
Internal meetings: This looks at the time spent in internal meetings amongst the engineering team and also meetings with product teams. If there is a lack of meetings with the product team, for example, this could be causing a backlog of issues to pile up.
Flowtrace is a meeting analytis and transformation tool that helps to identify and measure the health of an organization by looking at how team meets, communicates, and performs. By understanding how teams are working together and where potential issues may lie, companies can enact changes to improve handovers, workflow and increase productivity. In this article, we've looked at some of the most important metrics that Flowtrace measures and their impacts on an organization.

Learn more about Scrum ceremonies and how meeting metrics can improve them.
Discover how to measure and improve company culture using metrics, recommendations, and benchmarks for a data-driven approach to a successful...
We introdcute new meeting metrics for managers, which give business an overview where to save costs, and improve meeting effectiveness.