As Scrum teams look to improve their performance and deliver products more efficiently, the use of metrics has become increasingly important. Metrics can provide valuable insight into areas such as engineering cycle time, product cycle time, and employee wellness, allowing teams to identify bottlenecks and improve their processes.
One area that has traditionally been difficult to measure is team relationships and communication. These are subjective topics that are crucial to the success of a Scrum team, but they can be challenging to quantify. That's where Flowtrace comes in. We overlay the traditional metrics like product, and engineering cycle times on top of team's subjective metrics.
We understand the importance of these subjective topics and have developed a suite of metrics that allow Scrum teams to gain a better understanding of their team relationships and communication processes. Our metrics are designed to be easy to use and provide actionable insights, so teams can make data-driven decisions and improve their performance.
Understanding Engineering Cycle Time with Analytics
Engineering cycle time is a measure of the time it takes for an engineering team to complete a specific task or work item, from start to finish. This metric can be used to understand the efficiency of an engineering team and identify bottlenecks in the process. By tracking engineering cycle time, teams can gain insight into how long tasks are taking, how much time is spent on different types of tasks, and where delays are occurring.
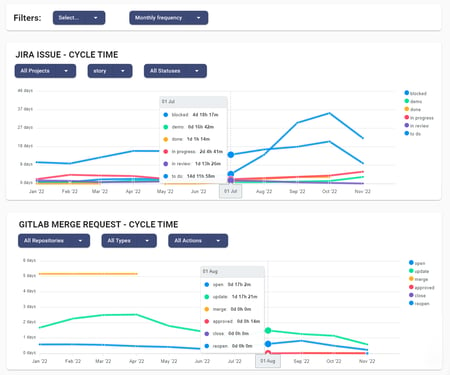
Flowtrace offers a suite of metrics that allow teams to track engineering cycle time and gain actionable insights. For example, our metrics allow teams to see how long each task is taking, how long tasks are spending in different stages of the workflow, and which teams are completing tasks the most quickly. Most commonly used metrics within our clients are pull request review time, lead-in time to review, and complexity of the pull request.
With this data, teams can identify bottlenecks and inefficiencies in their workflow and make adjustments to improve their performance. For example, a team might realize that tasks are taking longer than expected to complete, and decide to add additional resources to a specific stage of the workflow. Or, they might discover that certain teams are completing tasks more slowly than others, and provide them with additional training or support.
When tracking engineering cycle time with our metrics, you and your teams can make data-driven decisions and improve their efficiency, ultimately allowing them to deliver products more quickly and effectively.
Improving Product Cycle Time with Data-Driven Decisions
Product cycle time is a measure of the time it takes for a product to be developed, from the start of planning to the final delivery to the customer. This metric is important for understanding how long it takes to deliver a product and for forecasting delivery cadence. We integrate to most common product management tools like Jira, ClickUp, Trello, and more.
Flowtrace's metrics allow teams to track different aspects of product cycle time, including product lead time, work in progress time, and overall cycle time.
Product lead time is the time it takes for a product to go from a customer's order to the final delivery of the product. By tracking product lead time, teams can ensure that they are meeting customer expectations for delivery and making adjustments as needed.
Work in progress time is the time that a product spends being worked on before it is delivered to the customer. By tracking work in progress time, teams can understand how long it takes to complete a product and identify bottlenecks in the process.
Overall cycle time is the total time it takes to complete a product, including both product lead time and work in progress time. By tracking overall cycle time, teams can understand how long it takes to deliver a product and make adjustments to the process as needed.
With our metrics, teams can track these different aspects of product cycle time, gain actionable insights, and make data-driven decisions to improve customer satisfaction and delivery times. For example, tracking product lead time can help teams make adjustments so that they can meet customer expectations for delivery. Similarly, tracking work in progress time can help teams identify and address bottlenecks in the development process.
By tracking product cycle time with our metrics, teams can improve their performance, and make sure to delivery products on time, increase customer satisfaction and have better forecasting capabilities.
Surveys: Understanding the Connection between Teamwork and Productivity
 Employee surveys are a valuable tool for Scrum teams, as they can provide insight into how team members are feeling about their work and the team. These surveys can help identify issues such as burnout, disengagement, poor collaboration, and other factors that can negatively impact a team's performance.
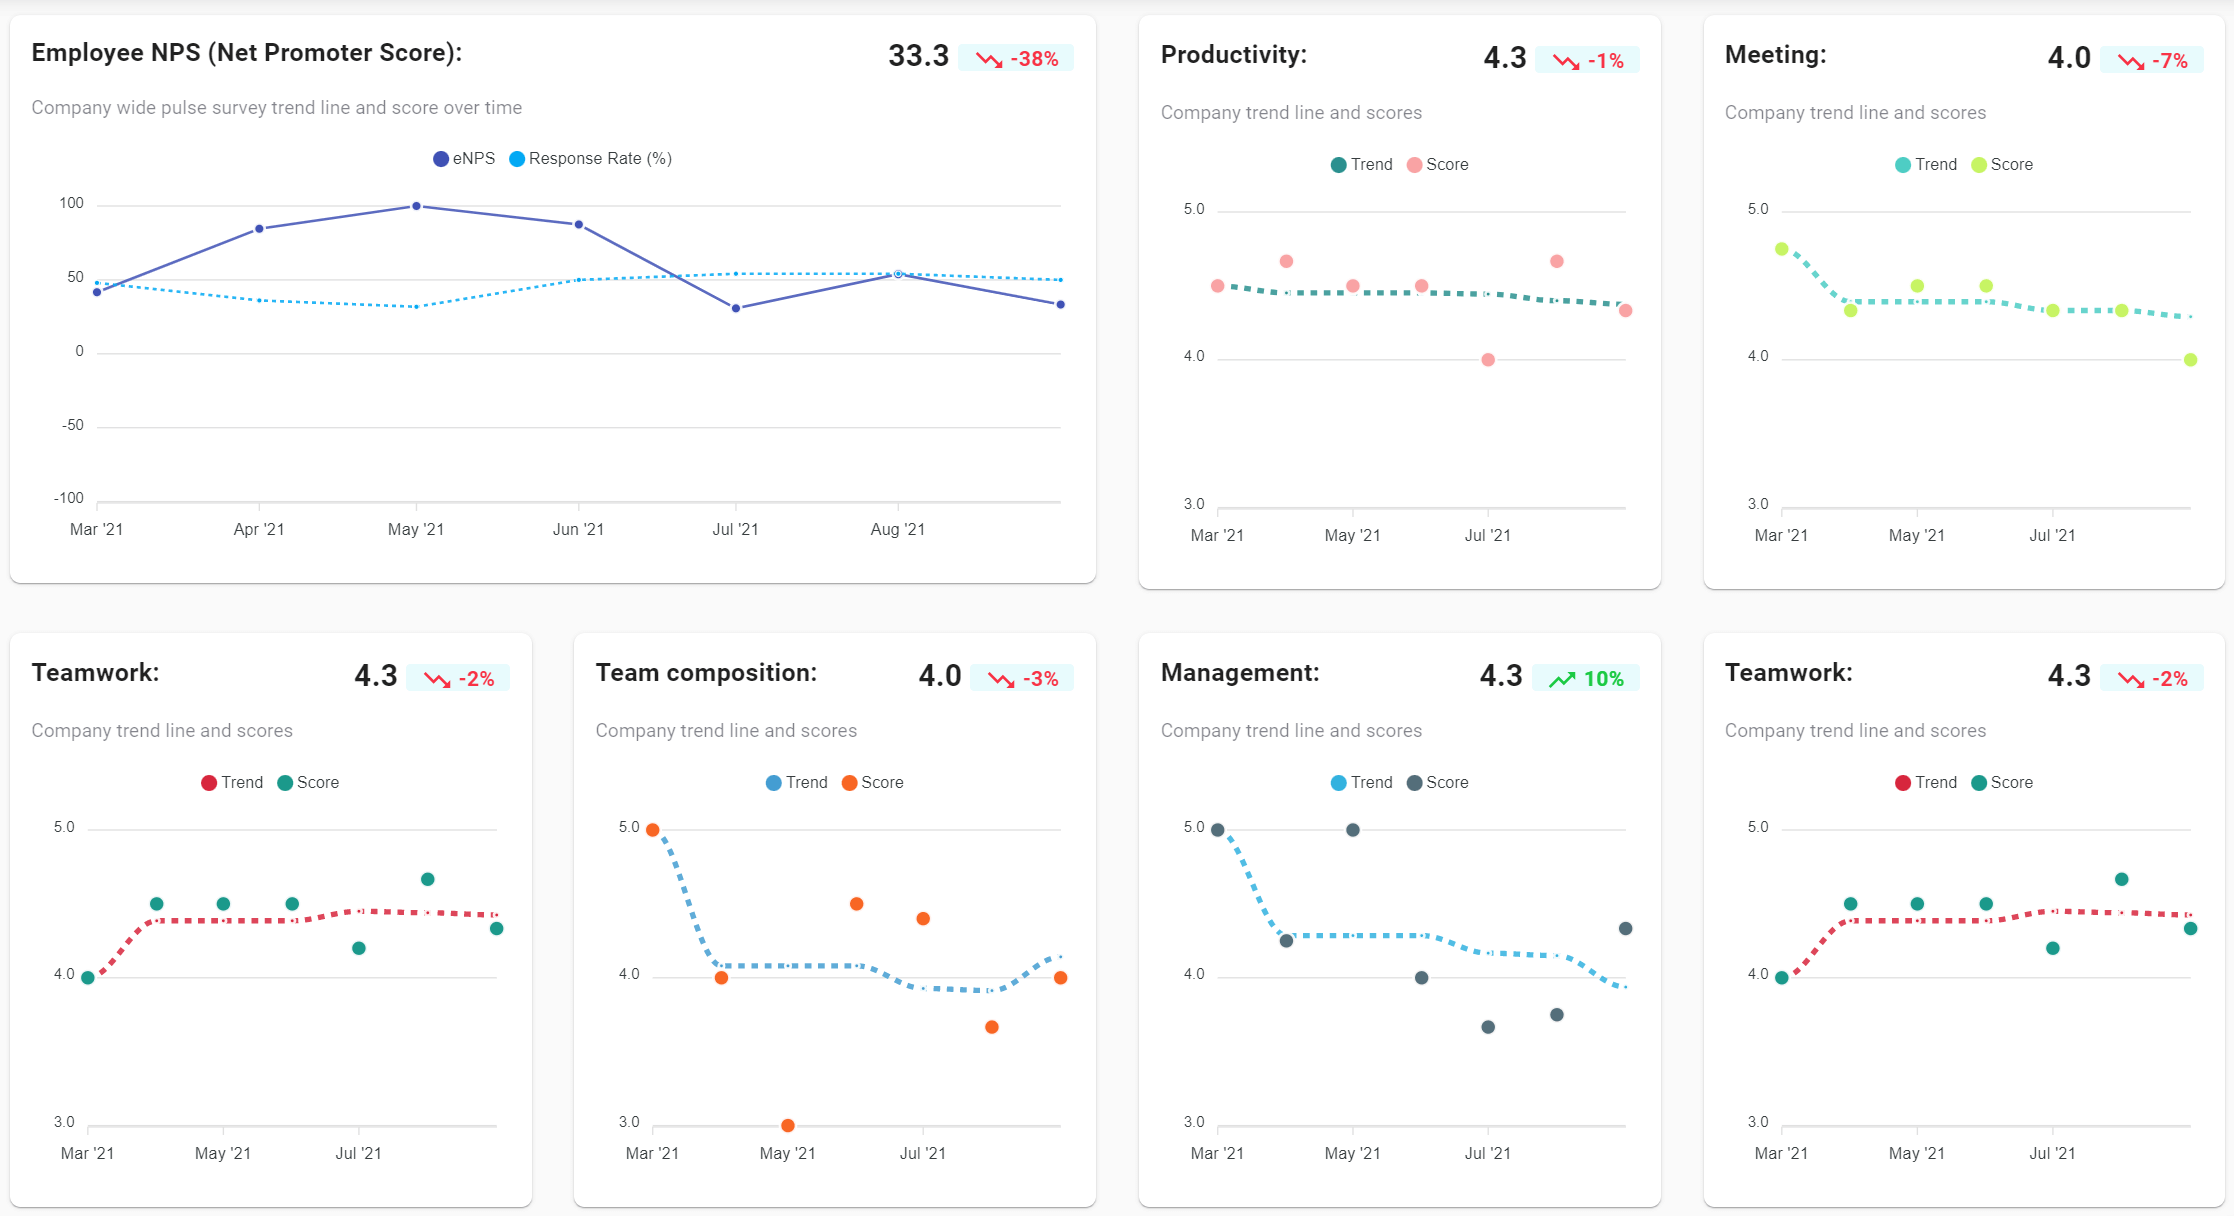
At Flowtrace, we understand the connection between employee happiness and productivity. Happy, unhindered employees are more likely to be productive and produce high-quality outcomes. That's why we have developed employee surveys that allow teams to gain a better understanding of their opinions about well-being, productivity, and teamwork to identify any issues that may be impacting their performance.
Our employee surveys are designed to be simple and straightforward to complete, allowing team members to provide honest and valuable feedback. These surveys are sent via Slack and takes no more than 2 minutes per week to answer and you start for free. We also provide metrics for analyzing the survey results, making it easy for teams to identify trends and patterns in the data.
For example, a team might conduct an employee survey and find that several team members are experiencing burnout, or red tape issues. With this information, the team can take action to address the issue, such as providing additional support or resources, or adjusting the team's workflow to reduce the workload.
By conducting employee wellness surveys, teams can gain valuable insight into the well-being of their team members and take action to improve the performance of the team. With a better understanding of the happiness and well-being of their employees, teams can make sure that their employees are productive and motivated, which leads to better results for the team and the company.
Meeting Metrics: Revealing Cross-Team Dependencies and Improving Sprint Delivery
Meetings are an important part of any Scrum team, as they provide an opportunity for team members to discuss solutions, identify issues, and make decisions. However, meetings can also be time-consuming and unproductive if they are not well-structured and managed.
Meeting metrics are a valuable tool for Scrum teams, as they can provide insight into the efficiency and effectiveness of meetings. Flowtrace understands the importance of measuring scrum team dependencies and the way teams meet over the sprints and have developed a suite of metrics that allow teams to track different aspects of meetings.
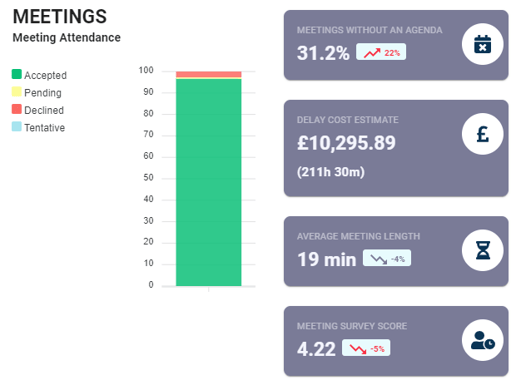
Flowtrace meeting metrics reveals teams with insights into how often cross-team dependencies occur, how long meetings are taking, and how much time is being spent on different topics during a sprint. By tracking these metrics, teams can identify any issues that may be impacting the efficiency and effectiveness of their meetings, and make adjustments as needed.
For example, a team might fidn that cross-team dependencies are are happening more frequently than they should be. With this information, the team can take action to ensure that cross-team dependencies are taken into account earlier, ensuring that all teams are aware of dependencies that might impact their delivery.
By tracking team's own meeting metrics, teams can improve their performance and make their meetings more efficient and productive. This can lead to improved communication and collaboration, which are critical to the success of any Scrum team.
Flowtrace: A Comprehensive Analytics Platform for Scrum Teams
Throughout this article, we've discussed the importance of metrics in Scrum and how they can be used to improve team performance. We've highlighted how Flowtrace's platform can provide valuable insights into areas such as engineering cycle time, product cycle time, employee wellness, and meeting metrics.
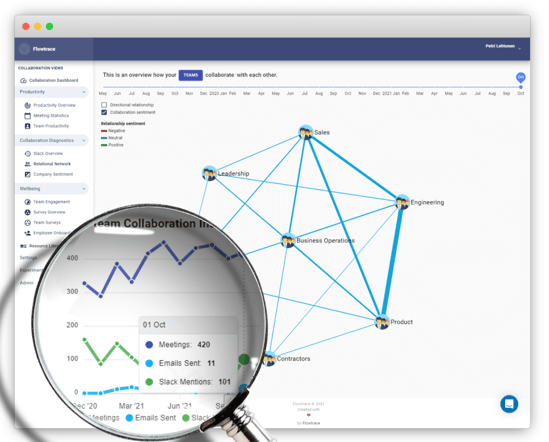
Flowtrace's analytics platform creates insights and recommendations for teams about their meeting culture, collaboration, and productivity, it allows teams to make data-driven decisions and improve their performance. It's user-friendly, and easy to implement.
You can find more information about our service and pricing options below. Our pricing tiers include a free plan and paid plans to suit any team size and budget. Whether you're a small startup or a large enterprise, Flowtrace has a solution that can help improve your team's performance.

Using metrics to measure and understand team performance can provide valuable insight and help teams to improve their performance. Flowtrace's analytics platform is an excellent tool for teams looking to use data to drive their performance and achieve better results. If you want to improve communication, collaboration and productivity of your team, consider taking advantage of Flowtrace's services and start seeing positive results today.