Analytics & Metrics
Internal Metrics For managers
Internal metrics are currently led by lagging indicators and do not work - it's time for a new set of management metrics to take businesses to the...
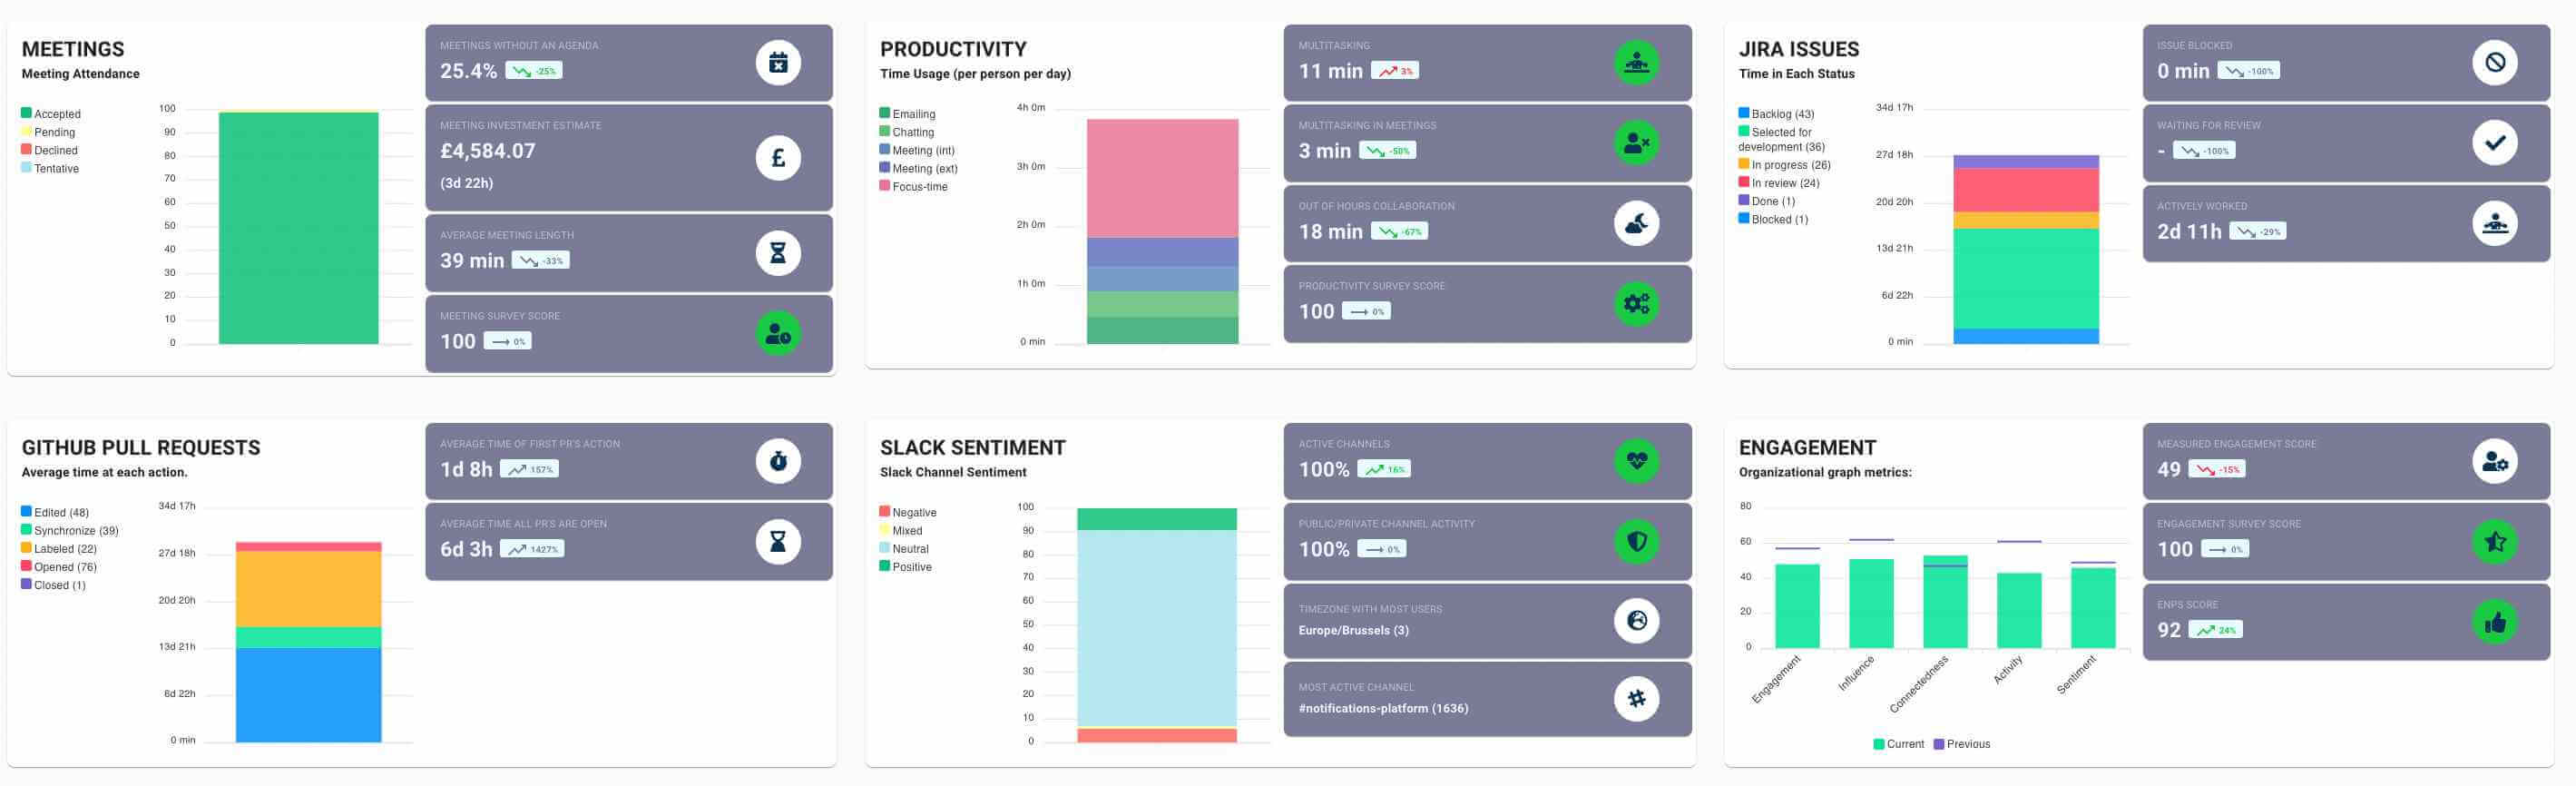
Flowtrace integrates with JIRA to provide real-time performance insights. It offers a range of metrics, including cycle times, and meeting metrics.
Tracking metrics is critical to the success of any software development team. It allows you to understand what your team is working on, what has been completed, and how your code performs in testing and production. With the right data, you can evaluate your team's performance and make adjustments to improve. JIRA is a popular project management tool that offers a broad set of reporting features, but to get advanced analytics, you may need to look at integrations.
One such integration is Flowtrace productivity analytics. This platform shows how your teams use JIRA and your internal processes to complete work. It offers real-time insights into the performance of your team and helps you identify areas for improvement. In this post, we'll discuss Flowtrace and how it can enhance your JIRA analytics, as well as some of the key metrics you can track with JIRA.
Flowtrace is a company analytics platform that offers a deep dive into how your teams use JIRA and your internal processes to complete work. It integrates directly with JIRA and offers real-time data and insights into the performance of your team. With Flowtrace, you can see how long tasks are taking, where bottlenecks are occurring, and what is and isn't working within your team's workflow.
Flowtrace offers a variety of metrics, including cycle times, team meeting analytics, and collaboration analytics. These metrics can help you understand how your team is spending its time and identify areas for improvement. For example, if you see that tasks are taking longer than expected to complete, you can investigate the root cause and implement changes to increase efficiency.
JIRA is a popular project management platform used by many startups and tech companies. It offers a range of features for tracking and managing tasks, including the ability to create custom reports and dashboards. JIRA's built-in graphs, powerful query language, and ability to tag, sort, and categorize project artifacts make it a powerful tool for tracking metrics.
There are a variety of metrics you can track with JIRA to understand the performance of your team. Some key metrics include:
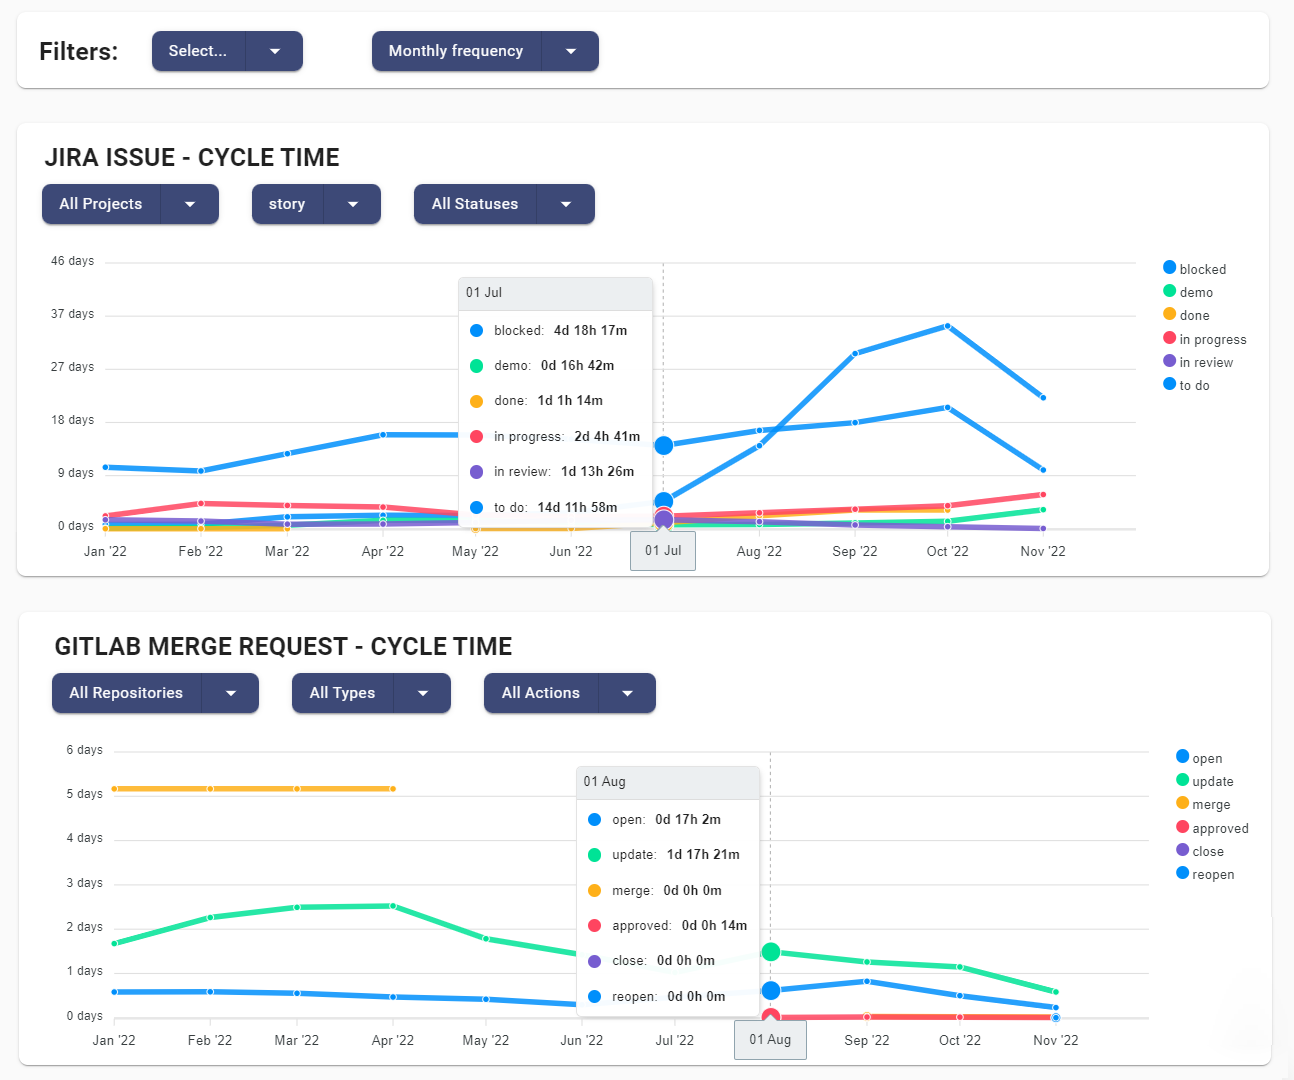
Lead time: This is the time it takes for work to be started from the time it is identified. Tracking lead time can help you understand how long it takes for work to be started from inception to work getting started and identify bottlenecks in your process.
Cycle time: This is the time it takes for work to be completed from the time it is started. Tracking cycle time can help you understand how long it takes for work to be completed and identify bottlenecks in your process.
Throughput: This is the amount of work that is completed over a specific period of time. Tracking throughput can help you understand how much work your team is able to complete and identify areas for improvement.
Flowtrace offers a variety of metrics that are created using data from JIRA. These metrics provide insights into the performance of your team and help you identify areas for improvement. Some of the key metrics that Flowtrace offers include:
Cycle times: Flowtrace provides information on the time it takes for work to be completed from start to finish. This can help you understand how long tasks are taking and identify any bottlenecks in your process.
Team meeting analytics: Flowtrace offers insights into how your team is spending its time in meetings. This can help you evaluate the effectiveness of your meetings and identify areas for improvement.
Collaboration analytics: Flowtrace provides information on how your team is collaborating and working together. This can help you understand the effectiveness of your team's communication and identify any issues that may be impacting productivity.
By tracking these metrics, you can get a better understanding of your team's performance and identify areas for improvement. Flowtrace's real-time data and insights can help you make informed decisions to increase efficiency and drive success.
In conclusion, Flowtrace is a powerful platform for enhancing your JIRA analytics and gaining real-time insights into the performance of your team. By tracking key metrics like cycle times, team meeting analytics, and collaboration analytics, you can get a better understanding of your team's strengths and areas for improvement. Flowtrace's integrations with popular tools like Google Calendar, GitHub, GitLab, and HubSpot only add to its capabilities and make it an even more valuable resource for your team.
If you're interested in learning more about Flowtrace and how it can help your team, we encourage you to check out the full range of features and integrations on the Flowtrace website. With its powerful analytics and real-time insights, Flowtrace can be a game-changer for your team's productivity and success.

Internal metrics are currently led by lagging indicators and do not work - it's time for a new set of management metrics to take businesses to the...
Scrum Team Metrics: A Guide to Improving Performance with Engineering Cycle Time, Product Cycle Time, Employee Wellness and Meeting Metrics
Use internal communication, meeting, and collaboration metrics to optimize sales pipeline and improve sales performance.