Analytics & Metrics
Jira Analytics for Engineering Teams
Jira analytics provides real-time intelligence for engineering teams. Our native integration allows you to explore insights with a 360-degree...
We integrated GitHub analytics into out decision intelligence platform. Use us to reveal hidden cross-team dependencies and resolve bottlenecks.
For many developers, any GitHub analytics which monitor and analyze code and commit activity is a red herring. It's a reminiscence of old-school lines of codes (LOC) metrics. In 2022 these metrics are at most based on vanity, but in worse, used to penalize proper engineering principles.
On the other hand, when your GitHub analytics shows you cycle times, bottlenecks, and dependencies across the teams, they help you spot problems and identify opportunities for improvement. When you combine your core GitHub metrics and layer them with insights from project management tools like Jira, collaboration tools like Slack, and calendar analytics, you have a holistic view that covers the end to end engineering processes.
We always recommend systematic analysis of root causes (i.e. 5 Whys) to identify the action you need to take. There are many potential reasons across the workflow that stop you from delivering the next feature, or product increment:
To this end, Flowtrace has recently integrated GitHub and GitLab into its decision intelligence platform and you can use them to reveal dependencies across your engineering workflows. You will have all the insights available to identify the root cause. No matter the source, or stage where your hiccups are borne, we can confidently tell you how to improve the things that matter.
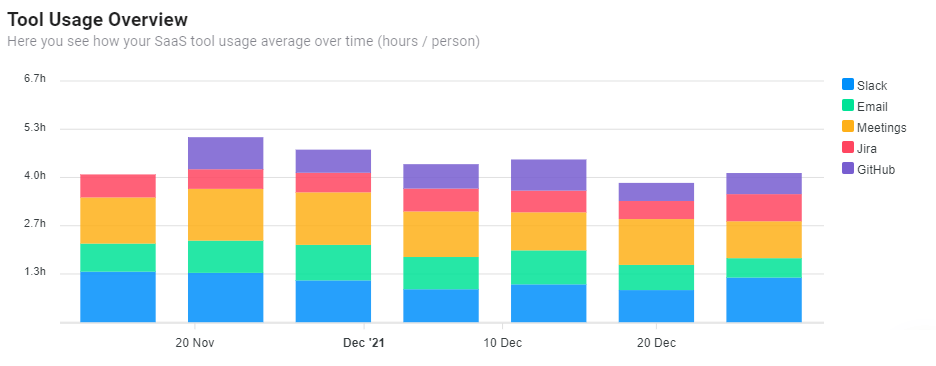
We combine your GitHub analytics deep into the collaboration tool insights we surface in our platform. Every insight and analytics view can be filtered with common Flowtrace parameters of dates, rolling periods, and teams. Here's an example of how we present SaaS tool usage across a deep-tech company of 30 employees:
The best part is, GitHub analytics is offered for free of extra charge on Flowtrace scale plans. The first step in integrating your GitHub (or GitLab) is to get to the Flowtrace integration page. From this page, you need to copy the unique integration URL which you use to create a webhook.
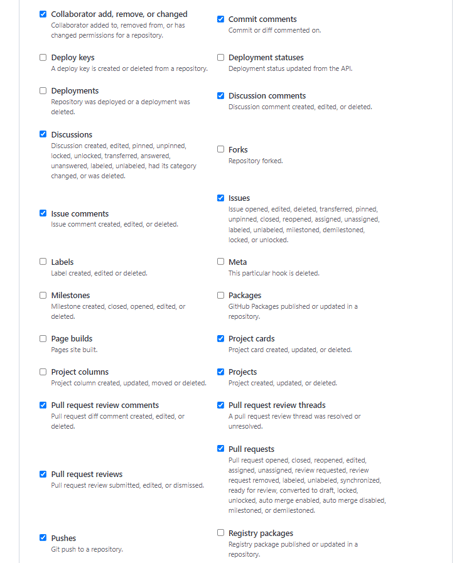 The second, and last step, is to go to your repository (or GitHub organization) which you want to integrate Flowtrace with and go to its Webhook configuration page. From this page, you can select all the events you want Flowtrace to analyse on your behalf. We recommend you select the events relating to team interaction as a minimum covering comments, pull requests, and issues. You have complete control over the data Flowtrace is analysing.
The insights we surface from GitHub are on an account level, and you can integrate as many webhooks as you deem necessary for complete engineering flow capture.
We want to also remind you that we are not interested in your source code, but those intentional moments when your team shares professional moments with their colleagues, like the pull request review cycle, and discussions around the code quality. The original information we receive is never stored in our systems, but just the metadata we extract from the original events GitHub sends to us. You can be assured there is no private data that can be leaked from our systems.
Flowtrace exists to improve communication and collaboration in the tech industry. We know how subjective these topics are, and equally, we know how inter-twined every aspect of engineering processes are. We are giving you a factual view of how your team collaborates and delivers software, but even more so, we show how the code delivery relates to the holistic whole of your company.
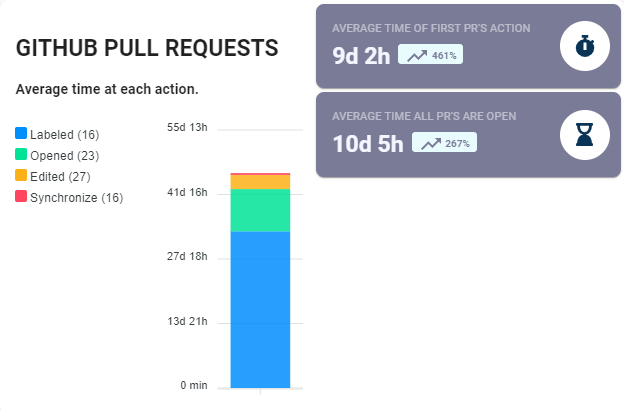
Using GitHub analytics, you can also see the amount of open and closed pull requests. It's possible to compare the number of open and closed PRs across different teams, which can give you a clear idea of how your team is performing. You can even see the trends of time it takes for PRs to progress from opening to merging. By filtering by the team, you can see how these pull requests statistics differ in their context.
This is a powerful way to get insights into potential reasons for problems or slow software delivery. Is it always the same team that slows the PRs, or is it just the plain amount of PRs which stop you from shipping the code and client features?
One of the best ways to see how your team is reviewing code is by looking at the average difference size of open pull requests. If this figure is high, it means that the code differences are significant. Maybe just some PRs has been complex, and is it because of this it takes more time to complete the review. A low number of lines means that the code is simpler than it is supposed to be and maybe shouldn't be reviewed in detail.
Do you know if your pull review cycle is delayed because of the availability of the reviewers, or the complexity of your team's pull requests? No matter what is the root cause, you can improve and optimize your development process to cater for the speed of review, while maintaining the sanity of the development flow.
We are often seeing cross-team dependencies in development workflow cause significant delays in the review throughput. Usually, the teams are first, and foremost responsible towards their own team, but sometimes the "overengineering" and "show-off" does kick in as part of the bigger engineering organizations. Maybe you should work towards minimizing those cross-team dependencies as most of the agile processes aspire?
Your technical team's collaboration is rarely captured by loads of conversations in an office space. A lot of this chatter is actually channelled through collaboration tools like Slack and productivity tools like GitHub. Showing, and demonstrating the complexities of technical collaboration for your team's in a factful way haven't existed before. When you use Flowtrace to show your team about the cycle times from GitHub, combined with Slack and Calendar metrics, you and your team can resolve the bottlenecks in a way never possible previously.
Even more so, the concept of collaboration in an engineering team has traditionally been even harder to describe to audiences like marketing, and sales teams, whose time in phone calls or meetings is often audible, and visible. We equip you with facts to enter these conversations to show how minor delays on input (from commercial teams) can have cascading negative effects on software development. Improving the cross-functional processes has never been easier when your organizational boundaries and team structure are completely visible in one place.
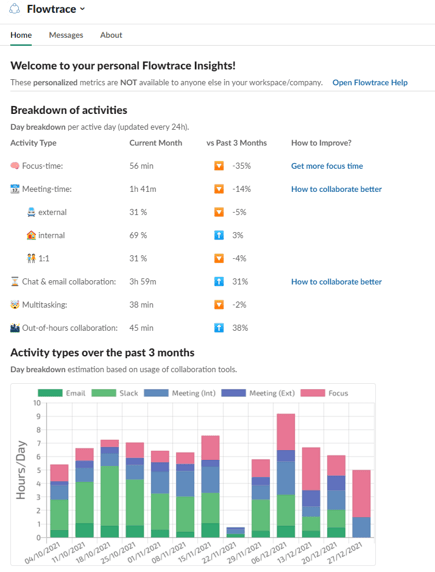
Our software is built to give teams, managers, and company leadership a complete view based on aggregated insights, preserving the privacy of everyone involved. On top of these insights, we provide personalised metrics for an individual in question using the self-service Slack app. This allows every employee of the company to create their own feedback loops to improve their working days.
We combine all your relevant GitHub metrics with our built-in collaboration analytics:
These metrics can be used to identify the best practices from all of your teams and share the knowledge for improvements. When you combine your internal benchmarks with Flowtrace's industry benchmarks, you can identify the aspects where your teams are good at, and where some coaching would result to the biggest improvements.
Company analytics tools like Flowtrace are useful because everything we mention is delivered to you, and your team in real-time, showing the impact of a process change immediately.
We are confident your teams will benefit from systematic root cause analytics tackling the thorny and hard to quantify issues in your next retrospective. You should not wait for any further but give Flowtrace and GitHub analytics a try right now!

Jira analytics provides real-time intelligence for engineering teams. Our native integration allows you to explore insights with a 360-degree...
Flowtrace integrates with JIRA to provide real-time performance insights. It offers a range of metrics, including cycle times, and meeting metrics.
Internal metrics are currently led by lagging indicators and do not work - it's time for a new set of management metrics to take businesses to the...