Best Practice Guides
8 Best ways to share file links in Slack
These are 8 of the best ways to share links in Slack and encourage your teams to stop using file uploads that are messy and unorganized.
Slack channel statistics are lacking the detail you need to improve your team's collaboration in public channels. Flowtrace gives you the metrics you need.
Slack's internal share of public channel messaging is a whopping 70 per cent. I don't recall seeing a company with this high level of communication transparency. Usually, when I join a company as a leader I find the public channel messaging hovers anywhere between 10-30% of the total messaging volume. Could it be one of the reasons so many of us set the wrong Slack transparency culture across the startups is that Slack channel statistics is a mere afterthought for them? This becomes a huge hurdle as teams grow and taking corrective action is near impossible with the statistics slack provides out-of-the-box.
Taking a ride on a memory lane to early '90s and IRC, one of the early instant messaging tools since the dawn of the internet, things feel different. Slack is in many ways IRC packaged in a nice web user interface including hashtags which indicate channel names. Although direct messages, group messaging, private and public channels were all part of the IRC, current company Slack usage don't remind me of the way how communication took place then.
What is it that skews Slack's communication style to direct messages and private conversations in the workplace? Is it the professional setting, organizational culture, or invasive notifications of Slack? Whatever the root cause, for efficient team communication, we need tools to address the way we use Slack.
If you are anything like us, you want to make sure the correct information flows in the team without artificial barriers. Slack's direct messages are notorious information silos. Direct message threads often hide critical information which is not searchable or visible to the team members who need it to do their work. In the worst case, the same question or information is copy-pasted between multiple people wasting precious time to get work done.
Managing the culture of public channel chatter over direct messages without the nuisance of constant interruptions is of importance. Imagine you have a set of metrics to help you balance the conversation taking place in public channels based on the information flow by telling you exactly where, what information, and who are the collaborators. With this information, we'd like to reward the people who enable people to stay on the same page.
We know not everyone in a growing team uses Slack the same with or without the detailed analytics. Based on our experience, every company has their own ways and culture, how to use Slack at work with colleagues, across the teams, and cross-functionally. It's also worth reminding we still meet new colleagues who don't have previous experience of Slack to rely upon when joining a company. We believe it is paramount to define, document, and educate team members on how we use Slack. We recently wrote Flowtrace's internal guide and wanted to share it for free with you: Slack Best Practice Guide and Policy.
Slack's built-in admin analytics is not good enough. It gives you metrics like how many people are active, and how many percentages of messages are sent in private channels vs public channels. These metrics are a blunt tool for the intricacies of human communication. It can be an indicator of potential cultural problems when direct messages hover beyond 90% of the messages sent week after week.
Now that you know you have a direct message problem by looking at the share of public chatter, how can you act on it? You could clarify the expectations towards your team, and what team discussion channels means. You have a feeling things are improving, but you cannot quantify it as the metric is so high-level aggregate. How would you know you are moving the needle towards the right direction in your team channel?
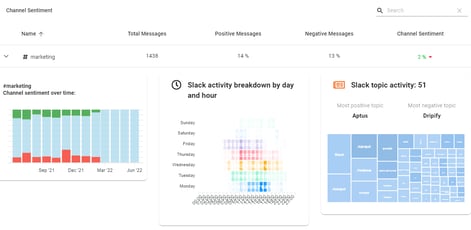
We take the Slack channel analytics to the next level by focusing on three actionable metrics and visualizations. These statistics are channel relationship map, topic insights, channel contributor map, and channel sentiment trends.
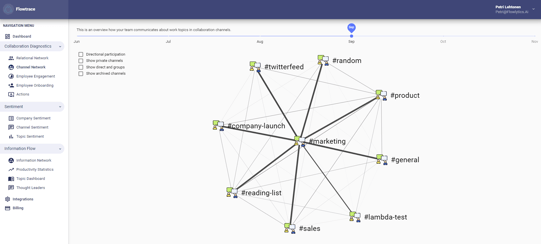 First, we look into all your public channels, and who participates in those conversations. Based on the metadata analysis, we paint an accurate image of how your channels relate to each other.
This allows you to understand information flow bottlenecks between channels, teams, and topics in hand. The benefits of restructuring your channels can be achieved in a short period of time.
We all experienced a project or managed a client account where things are not going according to the plan. We extract you all the topics your company talks about and reveal to you the insights about how your team talks about these topics.
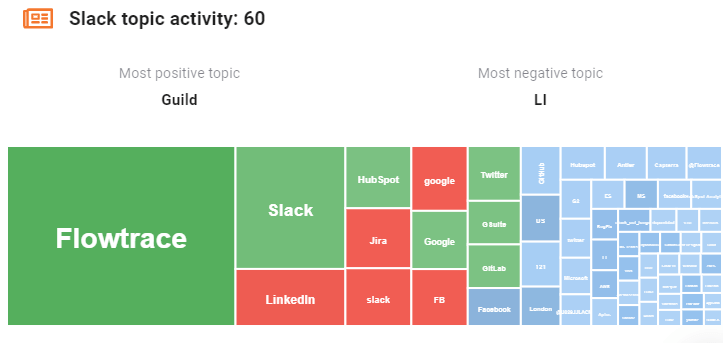
You will gain insights on the hot topics of your team, which topics they struggle with, or generally are not happy to work with. We do this so you can take corrective action to alleviate these pains.
We stack your publicly discussed topics on a chart where % of positive and negative messaging defines the area where the topic is shown. A quick glance at the size of the topic tells you the volume and possible severity of the issue your team is coping with.
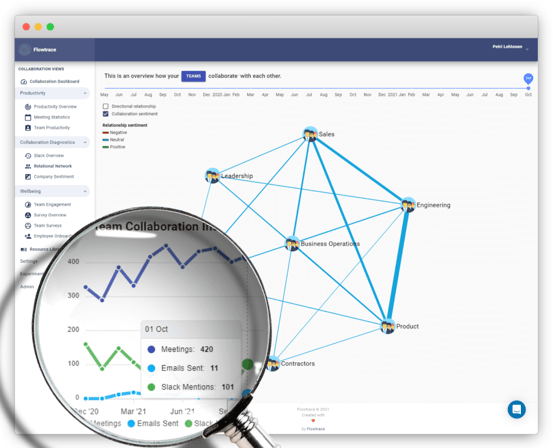
You need a drill down to understand your team's collaboration patterns. Who are the channels' participants and how they relate to each other? It's common that certain people raise questions more than provide answers. Other participants, like the thought leaders of the company, provide the answers and tackle the problems in hand.
When you can show your team status quo, and places to improve, team collaboration becomes a two-way (or more) street, instead of one-sided conversation drop and information share event. Repeating sources of questions can be addressed with knowledge sharing with the right tool, and the right time of the employee tenure.
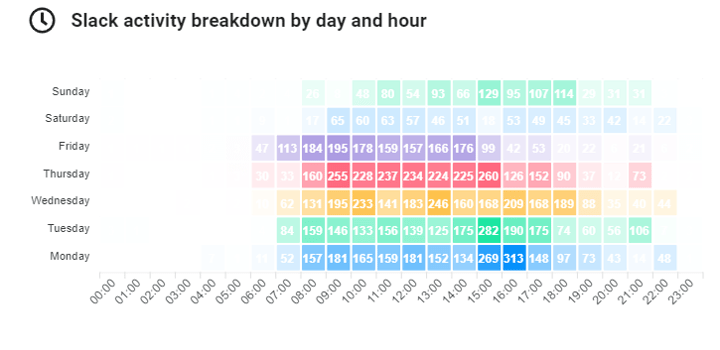
As part of our analytics pipeline, we capture the sentiment of the messages exchanged on public channels (and private channels where our bot is invited to) to give you trends of the conversation. Work includes ups and downs and this is often reflected how your team talks about the topics in hand.
You want to know if there is a dry spell of good news so you can huddle your team together. Company sentiment trend is further broken down to the level of individual channels. This gives you a possibility to drill down where the sentiment is originating, let it be a win or a negative upheaval. Tackle the dissatisfaction at the source, or share the good news where it didn't reach yet.
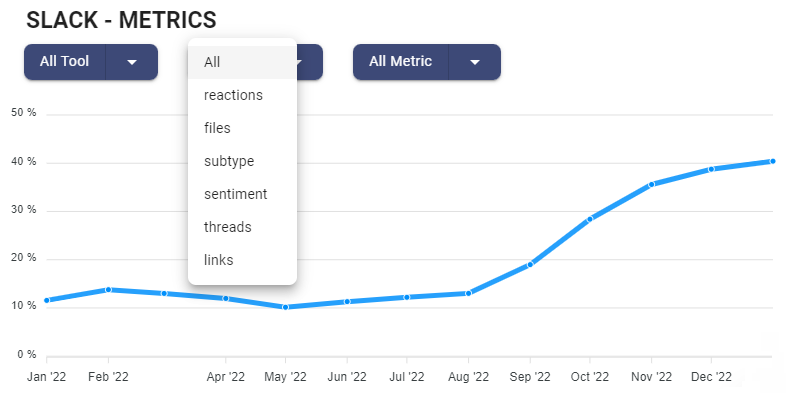
We also offer management metrics from your Slack workspace. An example of these metrics is thread usage, which many of clients have used to reduce distractionand drive best practices. In this example, Flowtrace recommended improving Slack thread usage across their teams, with actionable "how to" suggestions. This client improved Slack thread usage from 10% to 45% in just mere weeks:
You can try Flowtrace Slack analytics for free on 5 channels of your choosing. It takes only 2 minutes to install slack bot to your public channels and see how you can improve your Slack messaging culture. Over time, you can follow the trends and see the impact what your and your team's actions have on the collaboration patterns.

You can read more of our articles about communication transparency and collaboration analytics from our blog.
Edit: Originally published in November 2020, example screenshots updated and additional company topic sentiment added on March 2021. January 2022, added a Slack Policy Guide paragraph so everyone can start improving today. January 2023, added more Slack metrics and case study.
These are 8 of the best ways to share links in Slack and encourage your teams to stop using file uploads that are messy and unorganized.
Flowtrace's Slack Analytics Dashboard helps teams improve communication and collaboration with best practice metrics and actionable recommendations.
Use our Slack analytics to understand your team collaboration. We benchmark your usage to industry standards and best practices to create...