A company is developed on one foundation, but runs on multiple different processes and tools. Each department and team has its own responsibilities, work processes, and different requirements. In order to optimize productivity and target bottlenecks, it is essential to analyze data and know how to measure productivity from each process by understanding business process analytics. These processes must work together in harmonious coreography instead of wide gaps and cracks between them.
Productivity analytics can help you do just that by providing valuable insights into how your work processes are running. By understanding the data, you can make informed decisions on where to focus your efforts in order to improve productivity and reduce bottlenecks.
What is Productivity Analytics?
Productivity analytics is the process of tracking and analyzing data from your work processes in order to understand how they are running. This data can include anything from the time it takes to complete a task to the number of errors that occur.
Why is productivity analytics important?
Productivity analytics can provide data insights into the core processes of a company. This can help identify areas that need improvement in order to optimize productivity. Additionally, by understanding how different departments and teams are running their processes, you can develop a better understanding of the company as a whole.
You cannot simply apply blanket tool analytics across all functional areas of a business, as each team would have different requirements, responsibilities, and use cases for individual tools, therefore it is vital to break the data down and understand on a team level how to make informed decisions on this data.
Without the use of productivity analytics, the company as a whole could be falling behind and become a slowly sinking ship. As functioning tools belong to the core processes of businesses, if they are not being utilized correctly and bottlenecks are not resolved, teams will underperform and productivity rates will suffer.
Analyzing Core Business Processes Using Productivty Analytics
To gain the most value and insight from business process analytics, it is essential to evaluate the data from different teams, departments, or functions. For example, cycle time vs lead time would have entirely different implications and benefits for different teams.
By understanding how each department or team uses their respective tools, you can develop a better understanding of where to focus your efforts in order to improve productivity. Some of the key areas to look at:
Engineering cycle times and workflows
One of the key factors to focus on here is cycle time. This is the amount of time it takes to go from code committed to code deployed. A shorter cycle time means that changes can be made and deployed faster, which can be a major benefit for engineering teams.
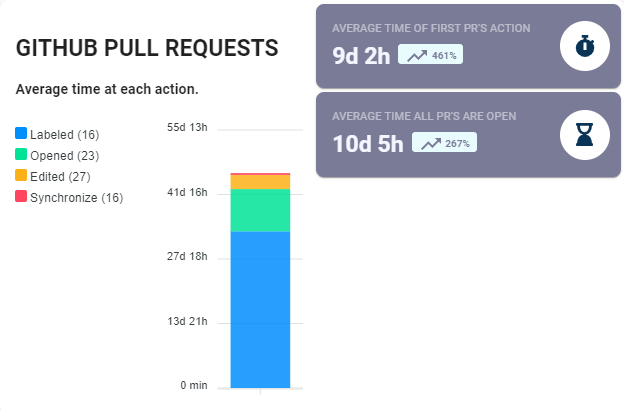
Additionally, it is important to track the number of errors that occur during this process. Factors that can impact your cycle time could include slow code reviews, a lack of automated testing, or manual processes. By understanding where and why errors are occurring, you can take steps to prevent them in the future.
Product development cycle times and workflows
When it comes to product or project management, cycle time is again an important metric to track. This is the amount of time it takes to go from an idea to delivery/completion. A shorter cycle time means that products or projects can be delivered faster.
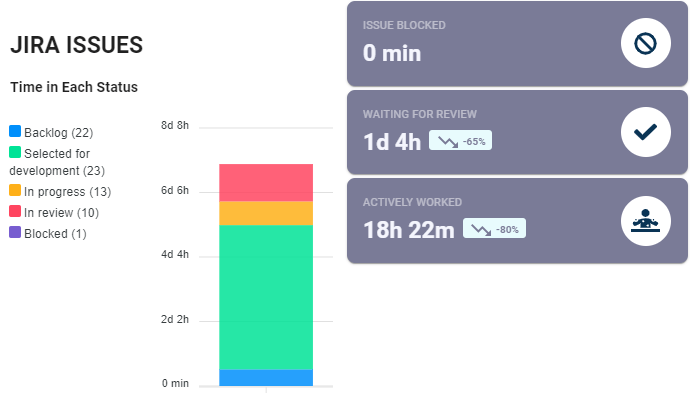
You can understand how long it takes for teams to deliver new features, how projects are progressing, and pick up any bottlenecks that occur along the way, which could include code review delays.
Additionally, it is important to track the number of issues that arise during this process. This could include anything from scope creep to communication breakdowns. These can be picked up by monitoring Jira analytics.
Customer experience and support workflow metrics
The front-line customer experience is vital for any business. In order to ensure that your customers are happy, it is important to track their interactions and support requests. Metrics can include call time, response time, satisfaction rates, and the number of issues resolved.
This data can be used to understand what issues are causing the most problems, identify potential areas of improvement, and see how the team is performing overall. Additionally, it can help to identify any training needs for the front-line team.
For example, if call times were considerably low or even high, but the number of issues resolved was low, there would be potential gaps in training, knowledge, or manpower.
HubSpot sales pipeline progressions
In order to understand the sales process, it is important to measure the deal flow stages. This includes the number of deals won, lost, or in progress and how long deal stayed in these stages. Additionally, it is important to track the number of leads and the conversion rate.
By understanding the sales pipeline cycle time, you can identify any bottlenecks in the sales process, see where deals are being won or lost, and understand the overall health of the sales pipeline. Additionally, this data can be used to develop strategies for improving the sales process.
For example, if you see that a high number of deals are being lost at the proposal stage, you can develop a strategy for improving the proposal process.
Find out more about HubSpot Analytics here.
HubSpot lead flow and origination
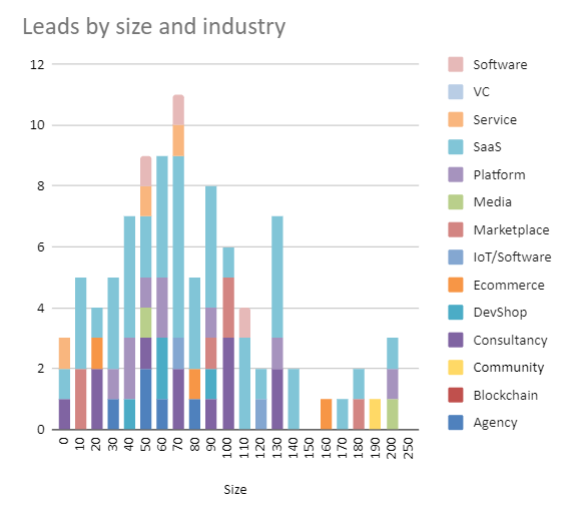
The lead flow is the process of generating and nurturing leads until they are ready to be passed on to sales. In order to understand the lead flow, it is important to track the number of leads, the conversion rate, and the funnel.
By using data from HubSpot, you can identify areas of your marketing funnel that are working well and those that are not. This would allow you to adjust strategies and optimize the funnel based on the data you received.
For example, if you noticed that the TOFU was receiving many drop-offs and only 10% were filtering through to the MOFU level, there would be an issue with something at the beginning stage of the funnel that would require more in-depth analysis.
Finance: Budgeting & Forecasting
The finance department is responsible for managing the budget and forecasting. In order to do this effectively, it is important to track the actual versus budgeted amounts. This data can be used to identify any areas where the budget is not being spent effectively, or where there may be potential for cost savings. Additionally, this data can be used to develop strategies for improving the budgeting and forecasting process.
For example, if you see that a high percentage of the budget is being spent on one area, you might want to investigate why this is the case and whether there are any opportunities for cost savings.
Arguably, this could be one of the most vital and primary focus points when it comes to analytics, as it can have an impact on all other departments/teams.
Collaboration: A Key Focus Area
Collaboration can help with the functions of a department, raising issues to do with products or projects, improving processes with suggestions, and increasing team productivity. It can also help to create a more positive work environment, as team members feel like they are being listened to and that their suggestions are valued.
By having the right tools for teams to collaborate with, some potential bottlenecks and issues could be resolved without the need for in-depth analysis. For example, if the engineering team is slowing in productivity due to bottlenecks in the product team, having a lack of collaborative insights and tools would further worsen the problem.
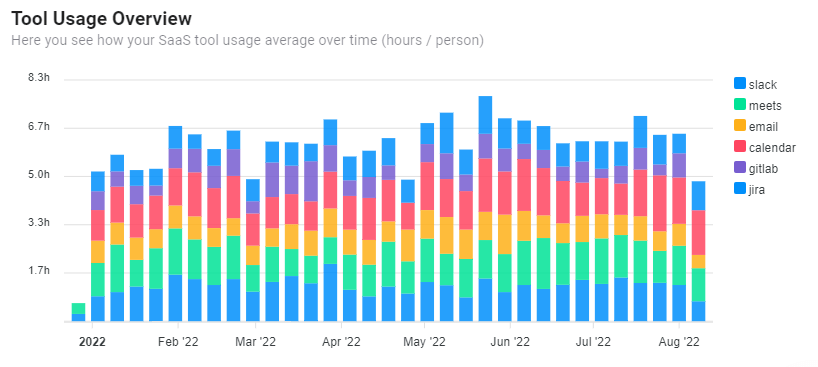
By using best practices in tools such as GitHub and Slack, processes can be sped up and communication issues/barriers can be removed. Adding collaborative measures for teams is a simple but effective step.
To understand the true value of collaboration amongst your teams, Flowtrace dives deep into collaboration analytics to understand productivity metrics, meeting efficiency, and inter-team relationships.
By tracking the right metrics, you can identify any bottlenecks in the process, see where there are opportunities for improvement, and develop strategies for making the overall process more efficient.
Conclusion
Productivity analytics is a crucial tool for understanding and optimizing the core processes of a company. By tracking and analyzing data from work processes, businesses can gain valuable insights into areas that need improvement in order to increase productivity and reduce bottlenecks. It is important to evaluate data from different teams, departments, and functions in order to develop a comprehensive understanding of the company as a whole.
Key areas to focus on include engineering and product process cycle times and workflows, as well as customer experience and support workflow metrics. Without the use of productivity analytics, a company may struggle to stay competitive and meet its full potential.
By utilizing tool like Flowtrace, businesses can make informed decisions that lead to improved performance and success. Ultimately, by understanding and optimizing the processes that drive the company, businesses can achieve greater efficiency and effectiveness, which leads to increased profitability and long-term success.