Meetings
Calendar Analytics vs Meeting Analytics
Discover the key differences between calendar analytics and meeting analytics, and learn how to improve organizational efficiency and meeting...
Learn how to identify and measure wasted meeting time to boost productivity with a data-driven approach. Discover actionable insights for better meeting management.
Modern organizations pride themselves on efficiency, yet few measure how they spend their most expensive resource: time. The rise of hybrid work has filled calendars faster than ever. Teams spend much of their week in recurring syncs, updates, and cross-functional meetings, but how much of that time truly drives progress?
The truth is simple: most companies don’t know where their meeting time goes or how much of it is wasted. They feel the symptoms, burnout, slow decision cycles, scattered focus, but lack the data to fix them.
This article explains how to quantify wasted meeting time, identify where it hides, and turn insights into measurable improvements. For Business Operations and Transformation teams, this is where meeting culture shifts from anecdote to evidence.

Meeting time becomes wasteful when it consumes more attention than it creates value. It’s not just about ‘too many meetings’, it’s about how meeting structures evolve without review, causing organizations to lose focus and slow down execution.
Over months and quarters, recurring meetings accumulate like unmonitored subscriptions. Each one seems small, a 30-minute sync here, a biweekly update there, but they multiply quickly. When no one audits or challenges them, they become a permanent tax on collective time.
Many updates don’t require synchronous discussion, yet remain on calendars out of habit. Asynchronous options like written briefs, shared dashboards, or short Loom recordings could replace them. But without clarity on purpose, teams default to live meetings, trading efficiency for immediacy.
Inviting everyone who might ‘need to know’ feels inclusive but fragments focus. Attendees multitask or attend passively, eroding engagement and quality. Harvard Business Review reports that 71% of managers find meetings unproductive and inefficient, yet attendance continues to rise each year.
Every time an employee leaves deep work for a meeting, they lose more than the meeting’s duration. It takes, on average, 25 minutes to regain focus after an interruption. Multiply that across daily meetings, and the productivity loss becomes enormous.
In many organizations, meetings symbolize alignment, collaboration, or leadership presence. Reducing them can feel culturally risky, as if less meeting time means less communication. Yet the opposite is true: when structured intentionally, fewer meetings often mean clearer priorities and stronger trust.
Before you can measure, you must diagnose. The signs of wasted meeting time show up long before the data does. Look for:
If these patterns appear consistently, your teams are likely operating at a structural deficit of focus time, and the only way to fix it is by measuring it.
This is the analytical heart of the process. The goal isn’t just to count hours, it’s to turn time data into actionable insight that reveals how your organization actually collaborates.
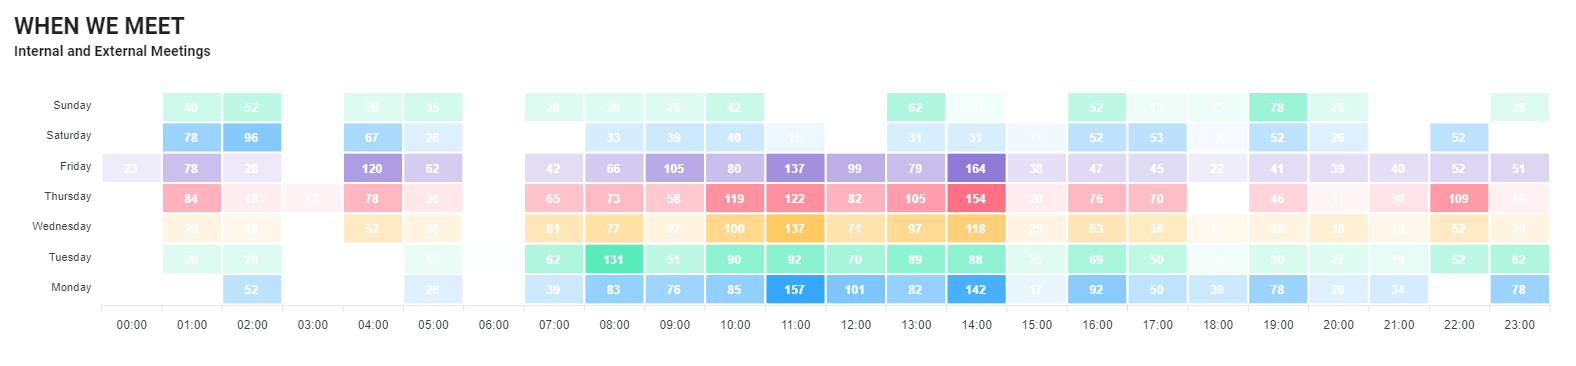
Start with a full audit of your organization’s calendar data for a representative period, ideally one quarter. Look at:
Plot this data across teams or functions. You’ll quickly see disparities, some roles living almost entirely in meetings, others starved of collaboration. This distribution shows not only workload imbalance but also cultural norms around time use.
What to look for:
These indicators often point to systemic inefficiencies rather than individual behavior.
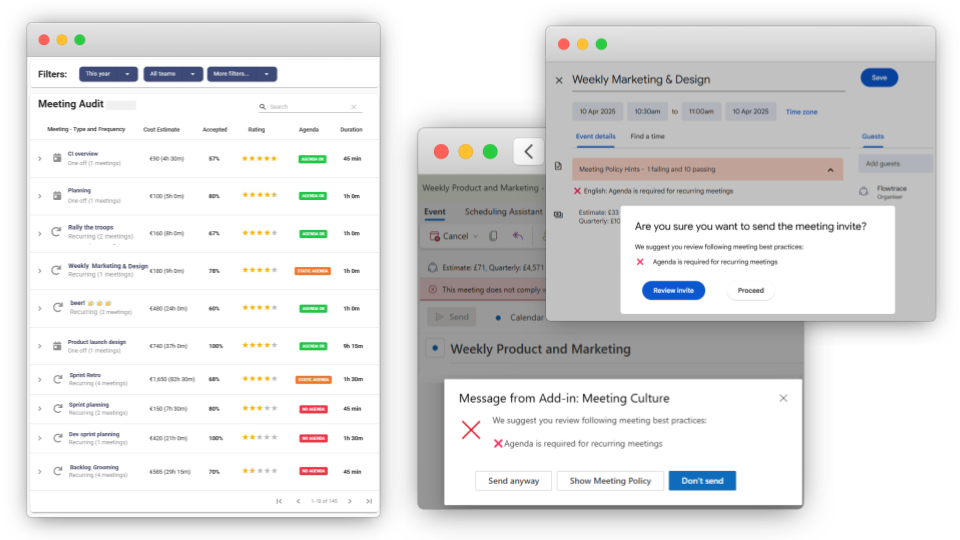
Recurring meetings are where the majority of waste hides, precisely because they feel normal. To evaluate, capture these details for each recurring meeting: Meetings that lack outcomes or ownership should be flagged for redesign or cancellation.
When evaluating recurring meetings, review these five key metrics to understand where time and value are being lost:
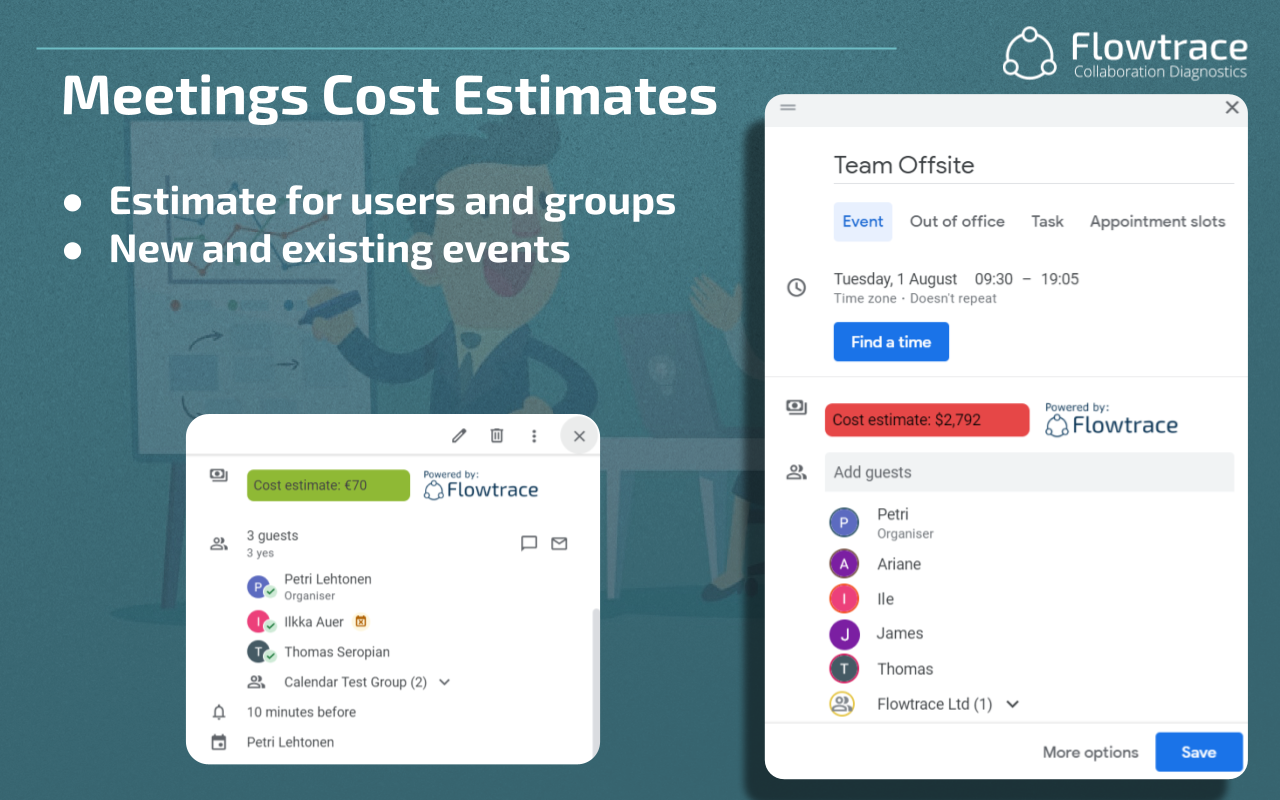
Calculate the recurring meeting cost using: (Attendees × Average Hourly Rate × Duration × Frequency per Year). This single step often shocks leadership teams into action because it turns abstract ‘time’ into budget.
For example, a 60-minute weekly update with 12 employees earning £75/hour costs roughly £46,800 per year. Multiply that by dozens of similar meetings, and the total annual cost quickly climbs into six or seven figures.

A truly healthy organization balances collaboration and focus. The Deep Work Ratio measures this balance directly.
To calculate:
A healthy range is 60–70% focus time, 30–40% meeting time. Teams consistently below 40% focus time are operating in reactive mode, constantly attending, rarely executing.
Flowtrace often sees that small shifts in scheduling (reducing one large recurring meeting or clustering collaboration into specific days) can recover 8–10% of focus hours within a quarter.
Another powerful way to measure wasted meeting time is to analyze decision velocity, how long it takes for discussions to translate into outcomes.
Track:
If simple operational decisions require multiple meetings or stakeholder loops, that’s a measurable indicator of inefficiency.
Compare teams or departments: faster decision velocity typically correlates with fewer, more focused meetings and higher overall engagement.
Now translate time into dollars.
Example:
Repeat across your meeting inventory and categorize:
The low-value category represents wasted meeting spend, a direct proxy for potential productivity gains.
Not all meeting time is equal. Executives, project leads, and engineers contribute differently to collaboration. Segment your analysis to uncover where inefficiency concentrates:
Visualize these insights in a dashboard to compare departments and leadership layers. When leaders see that they are part of the highest-cost meeting patterns, change becomes easier to justify.
Use external data to contextualize your metrics. Microsoft’s 2024 Work Trend Index found that employees spend 57% of their time communicating and only 43% creating - a clear signal of imbalance.
Benchmarking helps you set realistic improvement targets:
These are attainable goals when measurement precedes change.
Once you’ve established baseline metrics, automate your measurement process. Integrate data from calendar systems, meeting analytics, and time management tools to track improvements monthly or quarterly. Use dashboards that display:
Automation transforms meeting analysis from a one-off audit into an ongoing management capability.
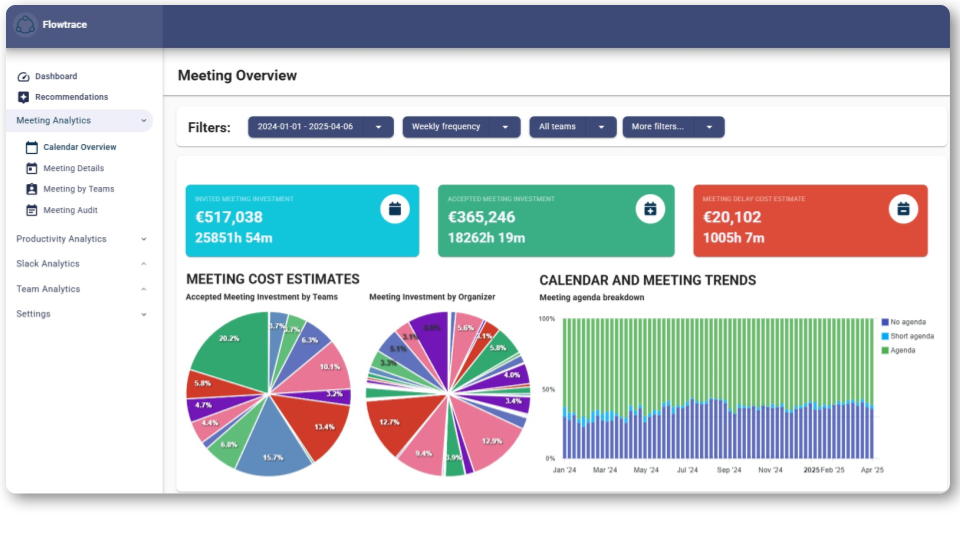
Manual audits provide valuable insight, but continuous visibility requires automation and normalization. Flowtrace gives organizations a holistic view of how meeting time is spent, what it costs, and how it changes over time.
.png?width=960&height=540&name=Marketing%20Images%20(11).png)
By consolidating these metrics, Flowtrace provides a single source of truth for collaboration analytics, helping leaders pinpoint inefficiency, demonstrate ROI from productivity initiatives, and sustain long-term culture change.
Wasted meeting time isn’t a scheduling flaw, it’s a visibility problem. Once leaders can see where hours go, they can redesign how work happens. Start with an audit, benchmark performance, measure deep work, and make the invisible visible. When you connect time, cost, and culture with analytics, every reclaimed hour becomes an investment in focus, creativity, and execution, the true drivers of modern productivity.
Discover the key differences between calendar analytics and meeting analytics, and learn how to improve organizational efficiency and meeting...
Discover how enterprise meeting analytics transforms meeting culture by measuring productivity, decision-making, and costs, leading to improved...
Discover the best meeting-efficiency software to optimize productivity, reduce meeting overload, and enhance deep-work time with data-driven insights...