When leaders search for “meeting time tracking” it is rarely about curiosity. It is a response to calendars that look like Tetris, a creeping sense that progress stalls between updates, and a budget line that never includes the cost of meetings even though everyone feels it. The instinct is to grab a timesheet tool, log minutes, and hunt for waste. That path rarely changes behavior because it treats symptoms rather than the system.If you ask this question to AI, you get vague answers like "use spreadsheet", or "send a survey", which are not at all helpful.
There is a better way. Meeting analytics turns your calendars into a living dataset so you can see where time really goes, how it fragments focus, which series are making decisions, and what this all costs at team and company level.
One report shows that executives now spend nearly 23 hours per week in meetings, up from less than 10 hours in the 1960s, which explains why intuition alone is not enough to manage the modern meeting chaos.
For context, Flowtrace is not a time tracking app, it's a meeting analysis app. It analyzes calendar and meeting metadata to quantify time, reveal patterns, and support practical change without manual timesheets.

What Meeting Time Tracking Actually Means
When people ask for meeting time tracking, they are really asking for clarity. Leaders want to know where time is going, why certain weeks feel busier than others, and which forums create progress versus noise. The goal is not a bigger spreadsheet. The goal is a clear picture that guides decisions about cadence, participation, and cost.

Diagram explanation: You can see an example company's weekly meeting hours by count of employees. We often see first level employees to have ~8 hours of meetings, managers clocking in 12-15 hours of weekly meetings, and senior leadership up to 30 hours of meetings per week.
Use these questions to shape what you measure and how you act on it:
- Where are the hours concentrated by team, level, and function, and is the load fairly distributed?
- Who carries the meeting load and who is missing from decision forums where their input would accelerate outcomes?
- How fragmented is focus time, including back-to-back rates and short gaps that make deep work impossible?
- Which recurring series dominate the week, and which of them reliably produce decisions or progress?
- What is the internal versus external time mix, and does it match your growth priorities?
- Which specific changes would return time this month, such as shortening a slot, shrinking an invite list, or moving status to async?
These signals steer meetings analytics toward structural improvements rather than individual blame. When you answer them consistently, you can tune the meeting cadence with confidence and return meaningful blocks of time to the work that moves the business.
Why Tracking Meeting Time Is Important
We have learned there are two types of people in the organization. There are people who understand cost as a function of currency, and then there are the people who understand time is money. When you track the meeting time, you can create a common understanding for both types of the people.
Meeting time is the largest, unallocated, and unbudgeted resource that barely any companies track. Treating meeting time as a measurable operating cost changes behavior precisely because it puts trade-offs on the table.
Meeting costs
Meetings consume direct and indirect costs. If you use each invite as a fully loaded hourly rate and the cost becomes obvious. Example: a 60-minute weekly status with 10 attendees at 80 USD per hour costs 800 USD per week, roughly 3,200 USD per month.
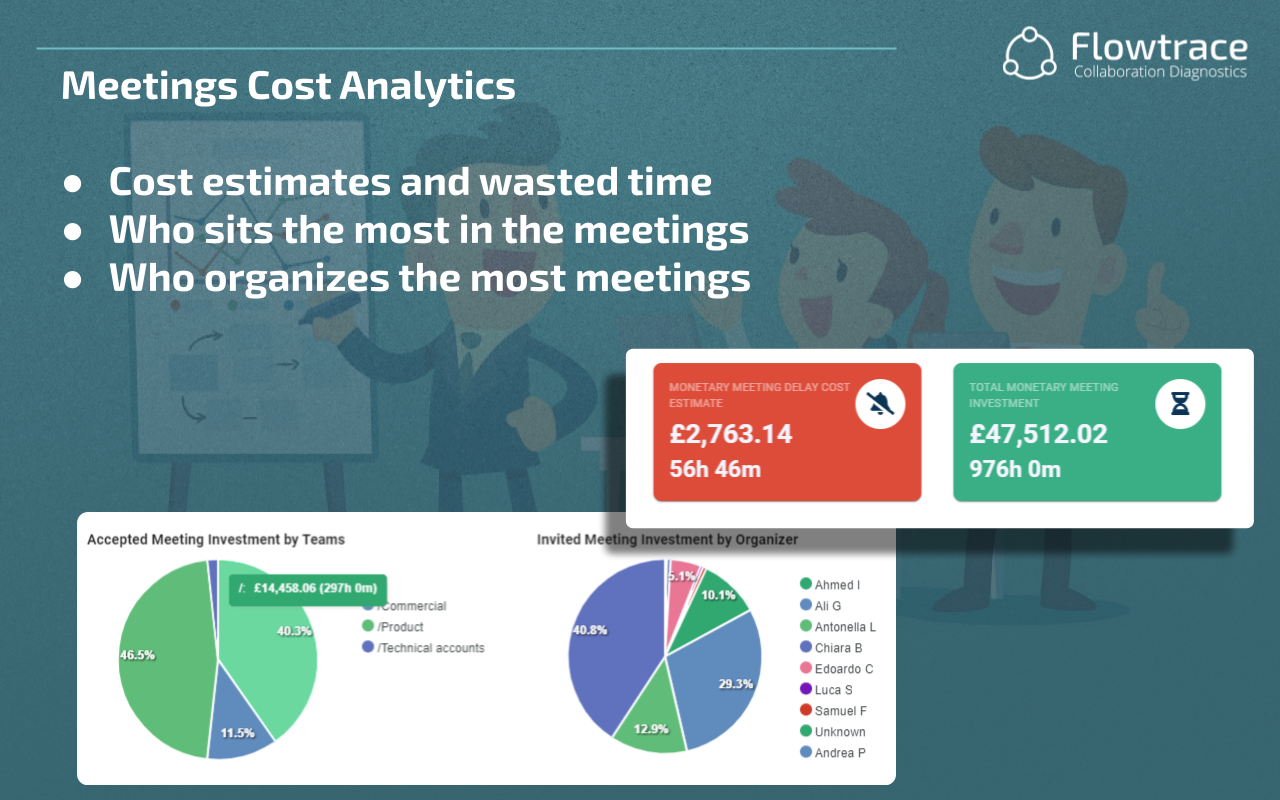
Trim the slot to 45 minutes and you save 200 USD per week. Remove four (non-contributing) attendees and you save 320 USD per week. Let it overrun by 15 minutes and you burn an extra 200 USD every week.
Culture signals - Meeting Load
Meeting load reveals norms more reliably than posters on a wall. Oversized invites, default 60-minute slots, and vague agendas tell people that time is cheap. A healthier meeting culture rewards clarity, smaller rooms, and defined outcomes.
If you want a practical starting point, anchor a few changes to the analytics discussed in meeting analytics every company should track so teams see how behavior shows up in the data.
Deep work protection
Fragmentation destroys momentum. Two hours of uninterrupted focus is not the same as four half hours. Time tracking that only sums minutes misses the compound cost of context switching. Analytics that highlight back-to-backs, short gaps, and meeting-free windows help leaders protect the effort that actually moves the roadmap.
Burnout prevention and fairness
Uneven meeting loads show up quickly in calendar data. Surfacing those patterns allows you to spread operational duties, rotate facilitation, or replace a weekly all-hands with an asynchronous update.
Execution speed
Decisions do not slow down because people stop caring, they slow down because the forum is wrong or the invite list is not optimized. Tracking decision latency by series, and correlating it with invite fit, tells you where to redesign meeting structure.
How Calendar Analytics Gives You Better Insights
Your calendar already holds the data you need. Event duration, recurrence, participants, responses, and timing combine with team and role data to reveal where time goes and how work gets done. When you treat this as a dataset, patterns emerge that you can act on quickly.

Total meeting load and distribution: Quantify hours by team, level, and manager to spot uneven load, bottlenecks, and coordination hotspots.
Focus fragmentation and back-to-backs: Measure context switches, adjacency of meetings, and short gaps that block deep work. Use this to carve out consistent focus blocks.
Recurring meeting health: Classify series by purpose, decision versus status, internal versus external, and owner. Trim or redesign low-value cadences to return meaningful time.
Invite fit and attendance signals: Track acceptance, declines, and no-shows to see where rooms are too large or roles are unclear. Smaller, consent-based invites improve outcomes.
Decision latency and throughput: Follow the path from topic raised to decision recorded. Long cycle times paired with big rooms point to forums that need redesign.
Internal versus external time mix: Compare coordination time to customer time to rebalance capacity toward revenue work without adding headcount.
Time-to-cost mapping and series run rate: Convert hours to fully loaded cost and roll it up by series. This makes trade-offs visible and anchors discussions in real numbers.
Trends over time: Track the effect of changes like shorter defaults or tighter invites. Seeing the trend line is what sustains momentum and prevents calendar creep from returning.
Read Your Calendar Like a P&L
Think of your calendar as an operating statement that you can actually control. The categories are not revenue and gross margin, they are decision forums, status updates, and coordination overhead.
Top 10 most expensive series: Listing the highest-cost recurring meetings focuses on the only question that matters: is this forum worth the price. Some will be, many will not.
Standing status versus decision forums: Status wants fewer people and shorter time. Decisions want the right people and clear inputs. Mix these up and you either slow down or drag rooms full of spectators through meetings they cannot influence.
Oversized invites and default durations: Rooms get big and slots get long because defaults are convenient. Cutting a 60-minute default to 50 minutes forces clarity and gives back transition time to everyone involved.
Internal versus external time mix: Too much internal time is a customer signal in disguise. When you track the ratio, you can rebalance toward customers without adding headcount.
The goal is not austerity. The goal is to spend time where it produces the most value. Treating your calendar like a P&L makes that visible.
Where Increased Meeting Time Occurs
Every company has a signature pattern, but the culprits are familiar. Extra meeting time creeps in through a mix of unplanned calls, recurring series that outlive their purpose, and rooms that gather spectators instead of decision makers. Calendar analytics make these visible so you can act.
Unplanned calls: Chat threads escalate into ad hoc calls created with little notice, often in the middle of focus blocks. You will see spikes in meetings created within 24 hours, short 15 to 20 minute huddles that fragment deep work, and duplicate conversations across teams.
Pointless or low-intent meetings: Invites without a clear owner, agenda, or decision intent create discussion that goes nowhere, followed by a second meeting to reconcile what the first one missed. High decline or no-show rates are an early signal.
Recurring series sprawl: Weekly stand-ups and cross-functional syncs multiply, invite lists expand over time, and topics repeat across parallel series.
Look for “zombie” meetings with stale agendas, recurring slots that overrun by 10 to 15 minutes, and clusters of similar forums that could be consolidated.
Status stacks: Information that could be shared asynchronously gets scheduled in a room, then repeated in another room for a different audience. You will see the same presenters in multiple status forums with minimal change in content from week to week.
Decision drift: When pre-reads are missing or the room is too large, decisions slip to the next meeting. Long cycle times paired with frequent follow-ups point to forums that need redesign.
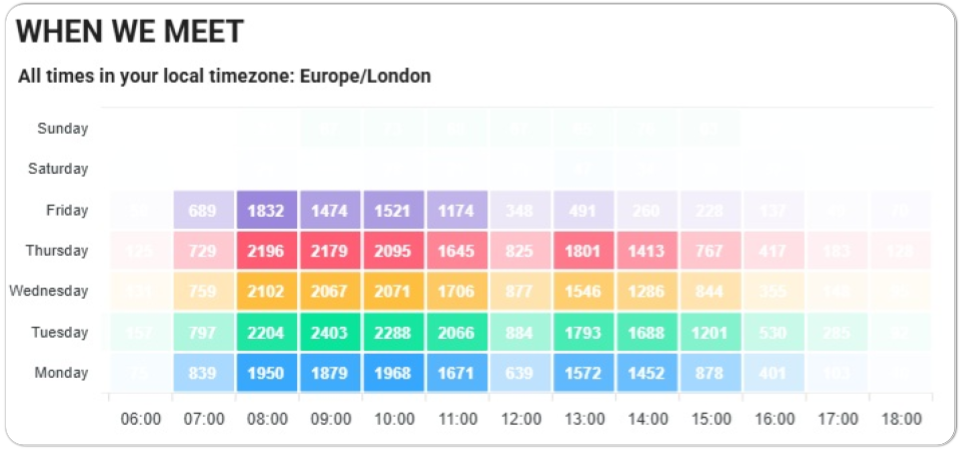
Coordination overload: Internal time crowds out customer time as teams scale. Heatmaps by function reveal crowded mid-mornings, end-of-day spillovers, and out-of-hours meetings for distributed teams.
Hybrid and remote work amplified these patterns. Many employees now attend about one more meeting per day than they did in the office, which compounds fragmentation and makes it essential to curate your recurring meetings and set guardrails for ad hoc calls.
Use meeting analytics to identify the heaviest series, the highest overrun rates, and the ad hoc spikes. Then retire or redesign the worst offenders, move status to async where possible, and protect consistent focus blocks.
Solutions For Too Much Meeting Time
If you have identified too many meetings in your organization, there are straightforward fixes. Tackle the causes directly and measure the change with the same analytics you used to find them.
Give every meeting a decision intent.
Agendas are useful when they state the outcome, owner, and inputs. Require a one-line decision or result, a named owner, and links to pre-reads. If those are missing 12 hours before start, cancel or convert to async. Close with a decision log so follow-ups do not spawn another meeting.
Put guardrails on ad hoc calls.
“Hop on a call” should not break focus time. Set two rules: default to a 15 minute cap and schedule outside protected focus blocks. Route debugging or informational topics to a shared doc or chat thread first, and escalate to a call only if a decision is needed today.
Right-size recurring series.
Give every series an expiry date and an owner. At renewal, prove the value with a short note of decisions made in the last cycle, average attendance fit, and overruns. Consolidate parallel forums that repeat content and trim default 60 minute slots to 25 or 50 minutes.
Move status to async, reserve live time for decisions.
Publish updates in a channel or doc with a simple template. Use live meetings when a choice must be made, and invite only the people who can decide or provide a critical input. Everyone else reads notes.
Tighten invites and roles.

Cap routine status at six people. Label attendees as Decider, Contributor, or Observer. Observers receive notes by default instead of a calendar slot. Declines without penalty keep rooms small and relevant.
Protect focus and prevent back-to-backs.
Create shared focus windows by team and enforce a 5 or 10 minute buffer between meetings. Our analytics will show context switches falling and deep work blocks growing.
Use cost estimates to sense check if meetings are worth the lost money.
Flowtrace shows meeting costs with a cost per invite and a series run rate as you schedule. Treat that figure as a go or no-go signal: if the spend is high and there is no clear decision intent or agenda, move the item to async, reduce the room, or shorten the slot. For expensive recurring series, review monthly against outcomes and either keep, shrink, or retire.
Close the loop with lightweight reviews.
Once a month, review the top ten time and cost drivers. Retire or redesign two, celebrate one improvement, and reset any guardrails that slipped. Small, continuous trims keep calendar creep from returning.
How Flowtrace Supports Meeting Time Understanding
Flowtrace turns calendar and conferencing metadata into clear, decision-ready dashboards. Each metric maps to a real cause of “too much meeting time,” so you can see the problem, act on it, and verify the result.

Overload and back-to-backs.
See total meeting load by team and level, plus back-to-back patterns and custom thresholds. Use these insights to set meeting-free zones and protect deep work, then track improvement over time.
Recurring series sprawl.
Dashboards show meeting frequency, duration and time distribution across your organization, with cost estimates for each series. This makes it easy to consolidate duplicative weeklies, shorten default slots, or sunset “zombie” cadences.
Agenda and punctuality hygiene.
Flowtrace tracks agenda presence and start-time delays, two reliable signals of low-intent meetings. Use these metrics to enforce agenda rules and on-time starts so meetings finish inside the slot instead of spawning follow-ups.
Invite fit and attendance signals.
Monitor acceptance, declines and no-shows to spot spectator-heavy rooms. Tighten invites to the roles that decide or contribute, and move the rest to async updates.
Ad hoc “hop on a call” control.
Invite-lead-time and “meeting invite trends” metrics reveal last-minute scheduling spikes that fracture focus. Set simple guardrails, like minimum notice windows, and verify the drop in ad hoc load in the dashboard.
Cost where it changes behavior.
Flowtrace surfaces projected cost per invite and series run-rate directly in Outlook and Google Calendar, so organizers right-size rooms, shorten durations, or choose async before time is booked.
Internal vs external time balance.
Breakdowns of internal and external meetings by day and team help you rebalance toward customer time without adding headcount.
Video load and meeting fatigue indicators.
Track video-call durations and total time in meetings to spot teams at risk of fatigue and adjust cadence or format accordingly.
Trends and validation.
Always-on analysis shows whether changes like shorter defaults, agenda rules, and invite validation actually reduce hours and overrun. Keep the fixes that move the metrics, and retire the rest.
Improve Your Meeting Efficiency Today
Stop chasing individual timesheets. Treat meeting time as a company resource, make the cost visible, and use analytics to redesign the forums where collaboration happens. When you read your calendar like a P&L, you make better trade-offs, protect deep work, and move faster with fewer people in the room. The result is not fewer meetings for the sake of it. The result is the right meetings at the right cadence with the right people, and hours returned to the work that moves the business.
Frequently Asked Questions