Meetings
How to Reduce Meeting Fatigue
Combat meeting fatigue with a data-driven system that optimizes schedules, enforces agendas, and promotes focused work for fewer, more effective...
Discover how org-wide calendar insights can transform meeting culture, reduce overload, and improve productivity with simple, actionable metrics and light governance.
Time is your most constrained operating resource, and it’s allocated, quietly and continuously, through calendar invites. When you only look at meetings one event at a time, overload feels personal and unsolvable. When you step back to an org-wide view, patterns emerge: where hours concentrate, where decisions stall, and where focus is fragmented into unworkable slices. Treating calendars as a system, not a collection of personal diaries, turns guesswork into evidence and makes change manageable.
Org-wide calendar insights aren’t about micromanaging people’s days. They’re about giving leaders and teams the same level of visibility and control over time that you already expect for budget, headcount, and tooling. With a shared picture of how time is spent, simple guardrails and light nudges are enough to shift behavior at scale.

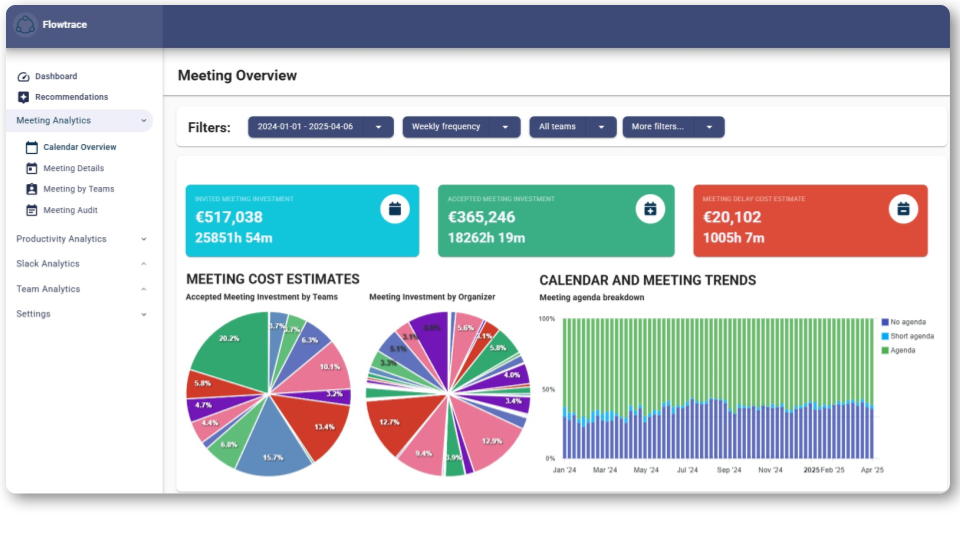
Calendar insights convert raw scheduling data into signals you can act on. At a minimum, you want to understand meeting load (hours and frequency), recurrence (which series consume the most time), fragmentation (how often deep-work windows are broken up), and overlaps (double-bookings, back-to-backs without buffers).
You also need quality markers: agenda presence and clarity, punctuality (on-time starts and overruns), invite size and role labeling (core vs. optional), plus a basic meeting taxonomy (decision, status, brainstorm, 1:1; sync vs. async).
When these signals are captured consistently, the conversation changes from “we have too many meetings” to “these three series, in these teams, at these times, are degrading outcomes, and here’s how we’ll fix them.”
 The goal isn’t to track everything; it’s to track the handful of meeting metrics that reliably produce better scheduling decisions.
This compact set keeps attention on the levers that matter. Teams can read these metrics at a glance and know exactly what to change next.
Segment your insights by function (sales, product, engineering, finance), role/seniority, time zone, and meeting type. Look at the world from both organizer and attendee perspectives to distinguish teams creating overload from those being pulled into it. Track trendlines weekly and quarterly so you can see whether policies are holding or drift is returning.
Segmentation turns abstract frustration into specific action. For example: Tuesday afternoon planning duplicates Thursday status across two groups; engineering has the best agenda compliance but worst fragmentation; leadership reviews start late and routinely overrun. Each insight points to a small, targeted adjustment rather than a sweeping mandate.
Dashboards should help people do things, not admire charts. Design views for each audience that answer “so what?” in one step.
Employees and managers need a calm view of personal and team load, the biggest time sinks, fragmentation patterns, and agenda compliance. The actions are straightforward: shorten or merge sessions, protect focus windows, add agendas, trim invite lists.
Ops/HR needs a cross-org picture of meeting policy adherence (agenda required, buffers, invite caps), overload hotspots, and equity patterns. Their actions are tuning guardrails, proposing no-meeting zones, and coaching teams with persistent issues.
Leadership needs rollups and direction of travel: cost by department, decision cadence indicators, the top opportunities to reclaim time, and the ROI from previous changes. The actions are light but decisive, sponsor quarterly resets, require pre-reads and outcomes for executive reviews, and hold a simple, predictable cadence for checking progress.
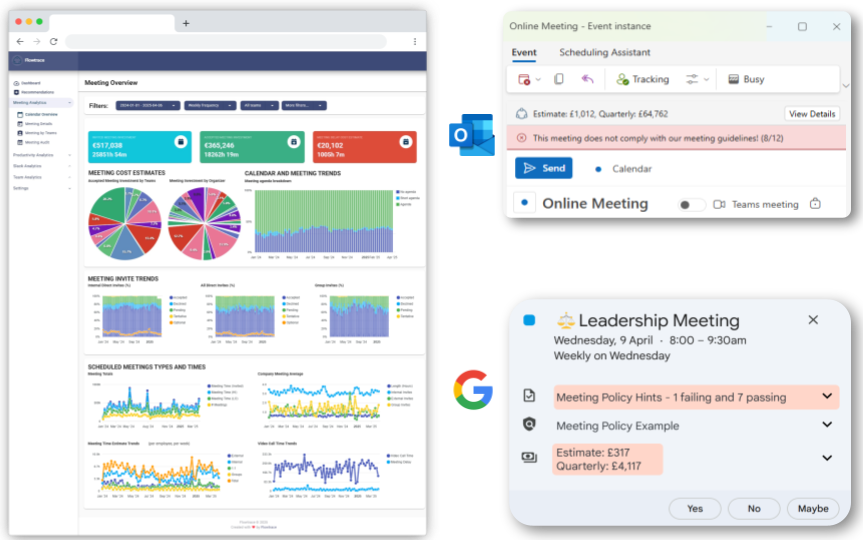
Heavy processes stall adoption. The most effective calendar programs rely on a few defaults and in-context nudges placed exactly where culture is made: at the moment someone creates an invite.
These small frictions are enough to correct most issues before they hit the calendar.

Overload is often about sequence, not sum. Five hours of meetings can be fine if they’re grouped and buffered; three hours can feel brutal if they slice the day into fifteen-minute shards. Use your insights to find fragmentation clusters and then fix the rhythm of the week.
A practical pattern: agree on one or two synchronized focus blocks per team each week; consolidate adjacent short meetings into a single, structured session with a clear agenda; and run a quarterly reset where all recurring series pause for a week and must be explicitly reinstated with purpose and size justified.
These moves don’t remove collaboration; they make it compatible with meaningful, uninterrupted work.
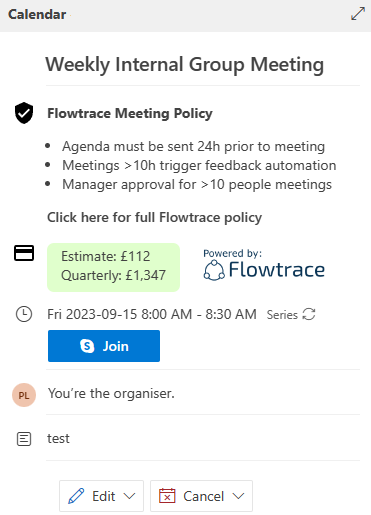
When teams see value vs. spend, behavior improves without mandates. Using Flowtrace, for example, you can see a simple, estimated cost per meeting in the invite. Tag outcomes, decision, action plan, escalation, so you can report an agenda hit-rate rather than hours alone. Rank meetings and series by “cost without outcomes” to target redesigns and retirements.
This reframes pruning from a top-down directive to responsible stewardship of a finite resource: time.
Analytics tell you what happened; participants tell you why. Keep feedback light and frequent so it actually gets used.
A two-question post-meeting pulse is sufficient: was this meeting necessary, and did we achieve the agenda outcomes? Add a quarterly sentiment check by team or function to catch chronic pain points. Most importantly, correlate feedback with your metrics. Low pulses paired with oversize invites signal stricter caps and role labeling; low pulses paired with missing agendas signal stronger gates.
Share what changed as a result. Closing the loop builds trust and increases participation in the next round of improvements.
Programs stall in predictable ways, and you should know how to anticipate them.
Define success in terms that connect directly to work and well-being. Review them on a simple, predictable rhythm and publish them broadly.
Look for fewer meetings per person and more deep-work hours month over month. Expect agenda compliance and on-time starts to rise, and overruns to fall. Track the cost of your top recurring series and aim to shorten, merge, or retire the worst offenders.
Most importantly, monitor decision speed, from problem identification to decision, and keep an eye on pulse scores (“necessary?” and “outcomes achieved?”). When these move together, you’ve improved both the calendar and the work.
High-performing teams run on clear expectations supported by simple systems. Executive reviews arrive with pre-reads 24 hours in advance; the invite shows an estimated cost, and outcomes plus owners are captured before the meeting ends.
Product and engineering share synchronized focus blocks twice a week; three overlapping status touchpoints become one structured session with a single owner and a short agenda. Go-to-market shifts routine updates to async dashboards and reserves live time for decisions with capped attendees, labeled core vs. optional.
Individually, each change is modest. Together, they create quieter calendars, sharper decisions, and fewer “why was I here?” moments.
Org-wide calendar insights replace intuition with evidence, and heavy process with light governance. When everyone can see load, fragmentation, recurrence, and outcomes, and when simple defaults nudge better design at the point of scheduling, meeting culture improves without drama. Start with visibility, segment to find your leverage points, set a few durable defaults that protect focus, and keep a lightweight feedback loop.
Over a few cycles, the signal is unmistakable: fewer back-to-backs, clearer outcomes, and a company that treats time with the same seriousness as budget. Tools like Flowtrace make that transformation measurable and repeatable, so you can see exactly where your meeting culture is improving and where to focus next.
Combat meeting fatigue with a data-driven system that optimizes schedules, enforces agendas, and promotes focused work for fewer, more effective...
Optimize meeting productivity with calendar agenda validation. Ensure every meeting has a clear purpose, structured agenda, and actionable outcomes...
Discover how Outlook calendar analytics can enhance productivity by revealing meeting patterns, focus time loss, and improving time management in...