Meetings
Meeting Cost Plugins for Google & Outlook
Optimize meetings with these meeting cost plugins for Google Calendar and Microsoft Outlook. Gain real-time cost insights to schedule smarter and...
Discover essential meeting analytics to track, improve collaboration efficiency, and boost productivity in your company. Learn how to use data to create better meetings.
Most companies spend thousands of hours each year in meetings, yet very few can answer basic questions about how that time is being used or wasted.
Meeting analytics give teams the visibility to understand what’s happening across their calendars: how often meetings run, how much they cost, whether people show up prepared, and where time is being lost. This isn’t about tracking people, it’s about identifying patterns, improving collaboration efficiency, and helping teams work smarter.
In this article, we break down the key meeting analytics every company should be tracking and how the data behind your meetings can become a driver for focus, clarity, and productivity.

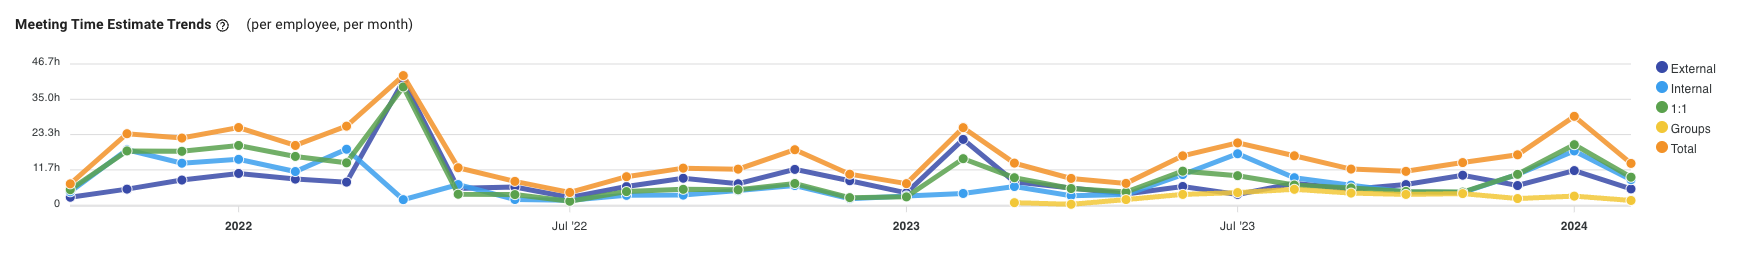
Understanding how much time your organization spends in meetings is the foundation of meeting analytics. This metric includes the total number of meetings scheduled and the cumulative hours spent across all types, internal check-ins, 1:1s, group sessions, and external calls.
On the surface, it’s a simple data point. But in practice, it provides one of the clearest views into your company’s collaboration load. When tracked consistently, it reveals whether your teams are operating efficiently or being dragged into too many conversations at the cost of focus work.
Time is a limited resource. Without clear visibility into how much of it is consumed by meetings, companies are flying blind. You may assume your team has room for project work, strategic thinking, or customer focus, but if they're spending 20+ hours a week in meetings, that assumption quickly falls apart.
Meeting volume also acts as an early warning system. Sudden spikes might signal reactionary planning, alignment issues, or a breakdown in async communication. Steady increases over time often point to calendar creep, more meetings getting scheduled without anyone noticing the bigger picture.
By tracking total meeting time, companies can:
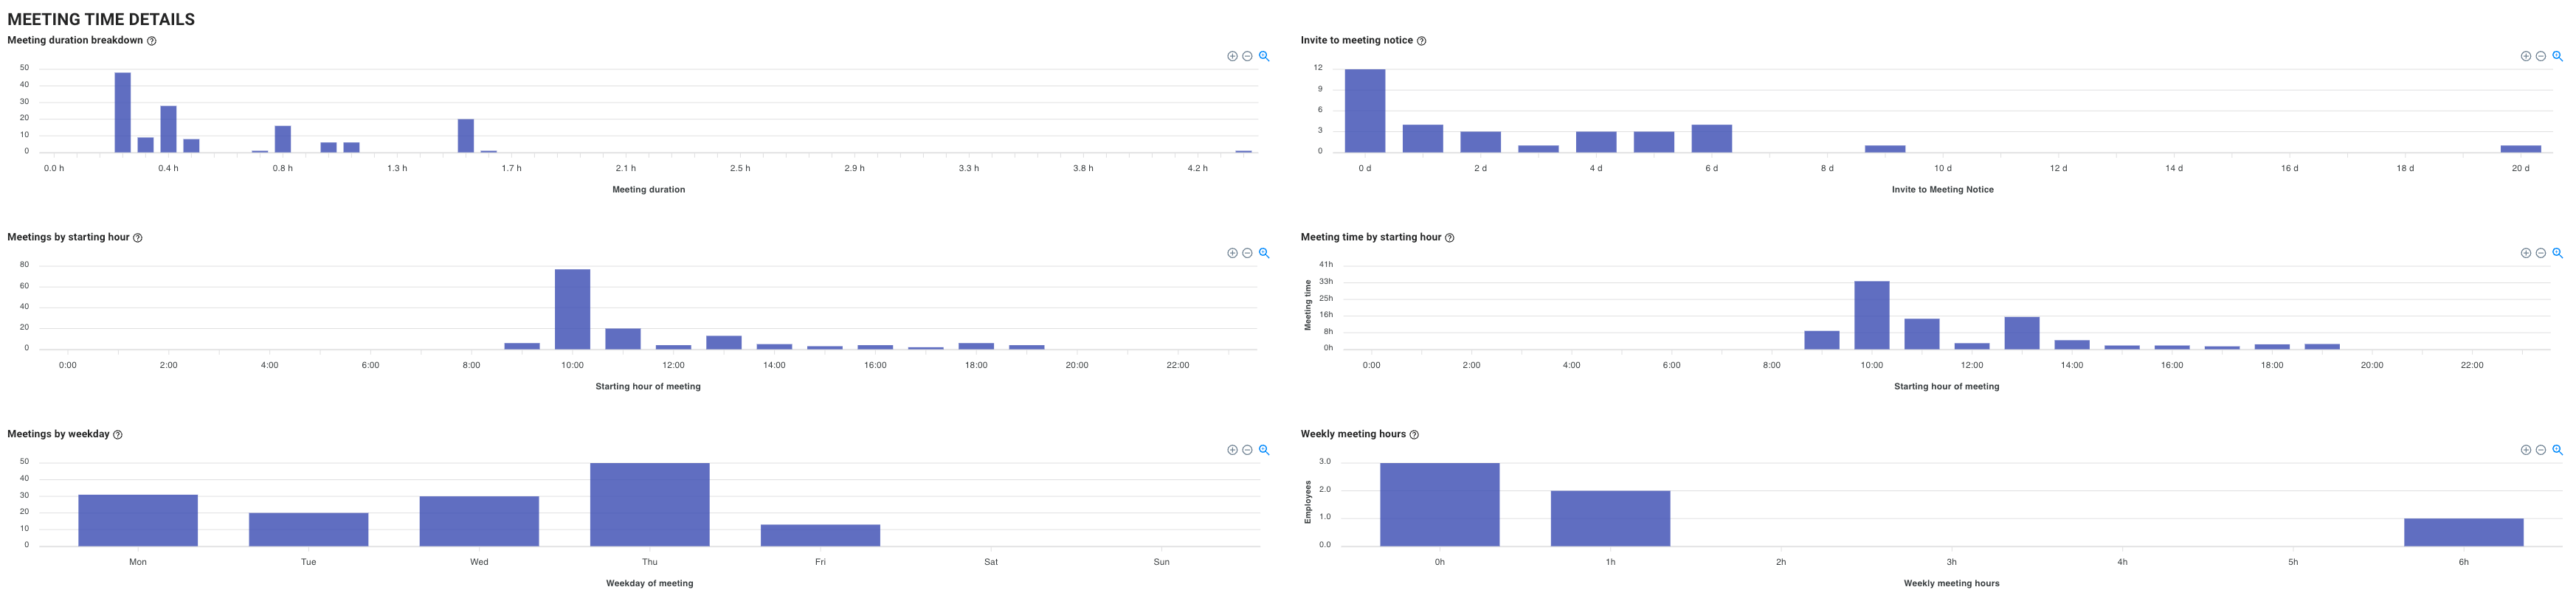
Meeting duration breakdown shows how long your meetings actually last, from quick 15-minute standups to hour-long planning sessions and multi-hour blocks. It highlights the distribution across common ranges (e.g. <30 minutes, 30–60 minutes, 60+), and helps identify unusually long or consistently bloated sessions.
Most meetings default to 30 or 60 minutes not because that’s what’s needed, but because those are the pre-set options in calendar tools. This leads to inefficient time use and meeting sprawl.
In fact, research shows that 71% of meetings are considered unproductive, and 67% of workers say excessive meetings keep them from doing their best work. When you understand how long your meetings really run, you can challenge assumptions about what’s necessary.
Long meetings are also closely linked to attention loss, especially in virtual settings. The longer the meeting, the higher the likelihood of multitasking, context-switching, and disengagement.
With a clear view of meeting length trends, companies can:
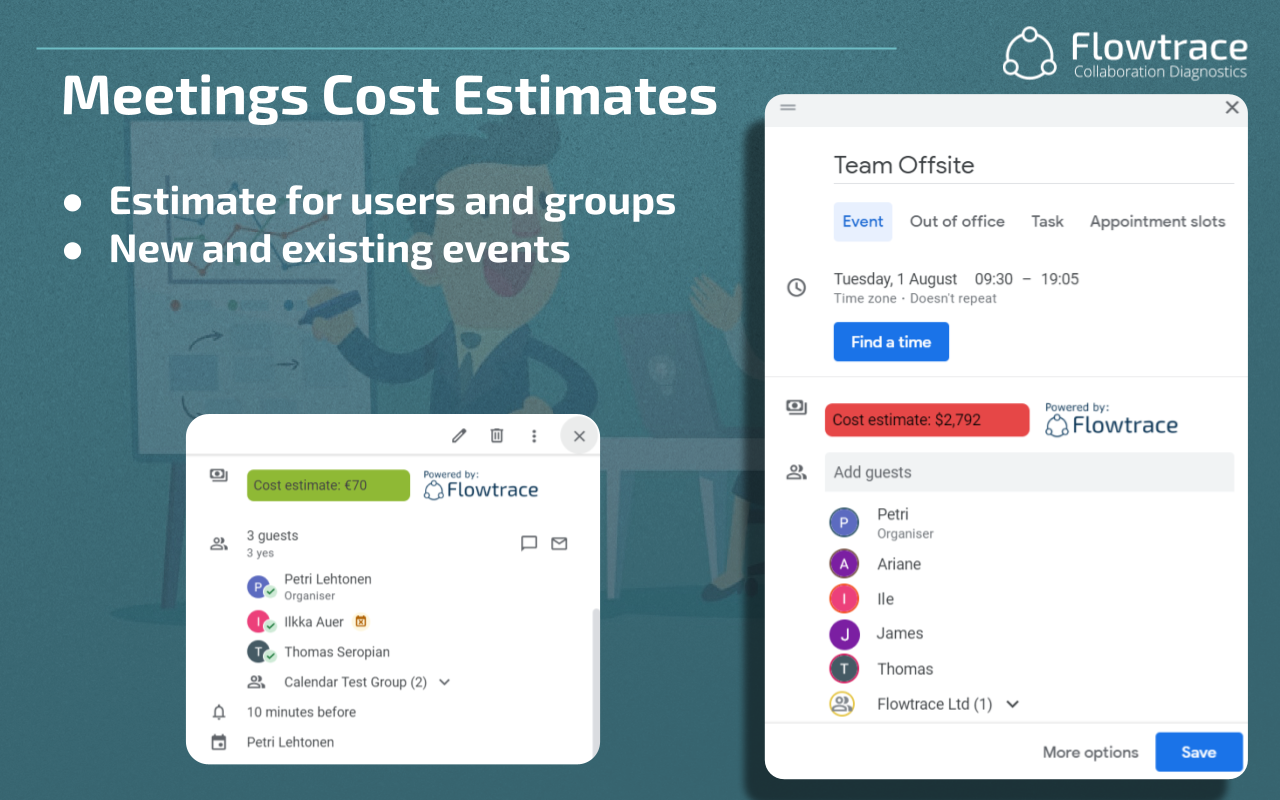
Meeting cost analytics reveal the true financial impact of time spent in meetings. Instead of thinking in abstract hours, you see real numbers, how much each meeting costs based on the roles and seniority of the people invited or attending.
This includes:
Every meeting is an investment. A 10-person, one-hour meeting with mid-to-senior level staff can easily cost $1,000 or more. Multiply that across your calendar, and the real cost of misused meeting time becomes staggering.
A study by MIT Sloan found that unnecessary meetings waste $25,000 per employee per year in large companies, often without anyone realizing it’s happening.
Cost visibility adds gravity to calendar decisions. It’s no longer “just a catch-up”, it’s a $600 catch-up involving five stakeholders.
With cost data in hand, teams can:

Meeting delay tracking monitors how often meetings start late, and how much time that delay adds up to. It calculates this as both total minutes lost and financial impact, often split by organizer vs. attendee behavior.
A few minutes here and there may seem harmless, but across dozens of meetings and hundreds of employees, they accumulate quickly.
According to a study by Doodle, 37% of meetings start late, with the average delay adding up to 10–15 minutes per person per week (Doodle, 2020). That’s thousands of hours lost each year, and significant cost if those delays involve senior staff.
Late starts also create ripple effects, pushing back the next meeting or interrupting focus blocks afterwards.
Tracking delays helps teams:

Agenda presence tracks how many meetings include a clear agenda, whether it’s fully detailed, loosely outlined, or missing altogether. It also reveals how consistent different teams and individuals are in preparing and sharing agendas before a meeting begins.
When meetings don’t have agendas, they tend to lack direction and waste time. Without a defined purpose or structure, discussions can meander, decisions stall, and participants leave unsure of what was accomplished. Worse, unstructured meetings often pull in too many people for unclear reasons.
Agenda presence is one of the strongest predictors of meeting effectiveness. It shows whether organizers are planning with intent, or scheduling out of habit.
With visibility into agenda usage, teams can:

Invitee analytics show how many people are being invited to meetings, and how often attendees are marked as optional. It reveals trends in meeting size and identifies when meetings are routinely overbooked with too many participants.
When meetings include more people than necessary, they become harder to manage and more expensive, both in time and productivity. Optional attendees often feel obligated to attend anyway, which creates passive involvement and unnecessary calendar load.
Over-inviting isn’t just inefficient, it’s a signal that organizers aren’t thinking critically about who actually needs to be in the room.
Tracking invitee counts helps companies:
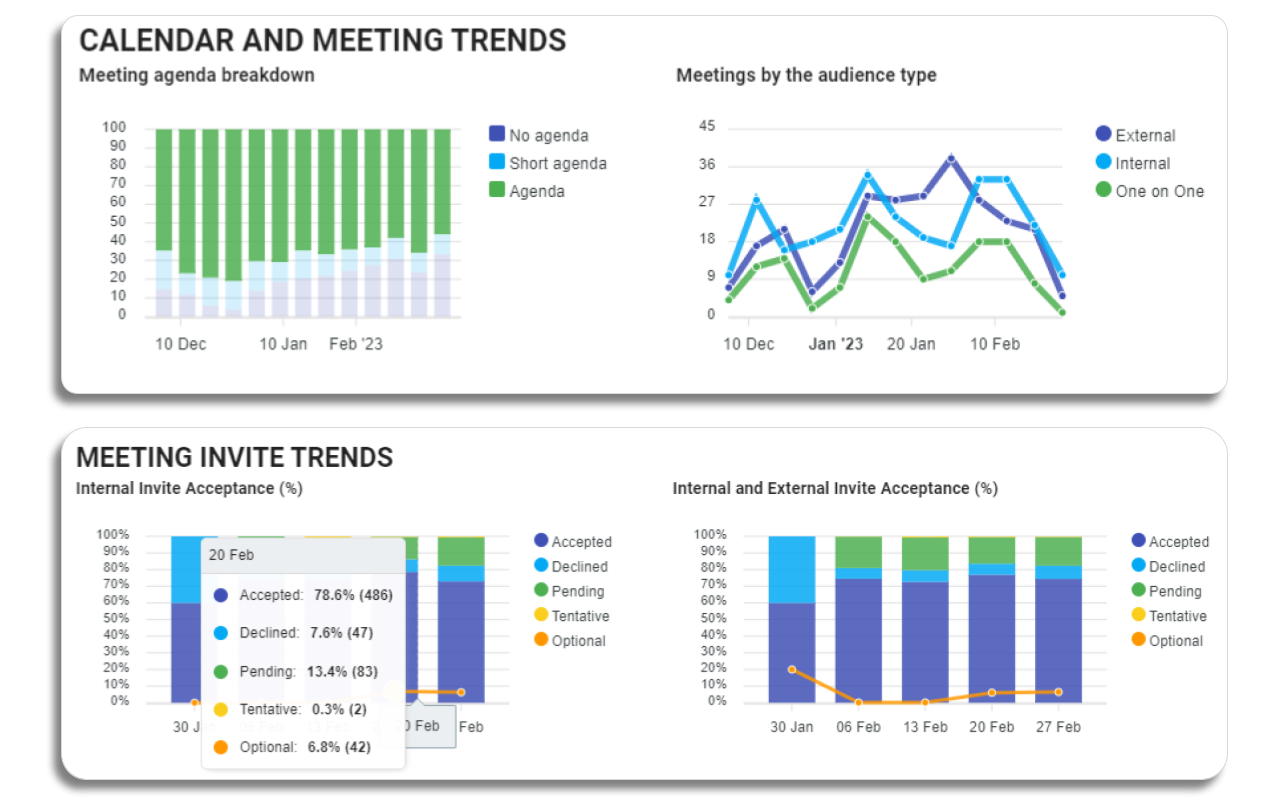
RSVP tracking shows how people respond to meeting invites, accepted, declined, tentative, or left unanswered. It captures response patterns across internal and external meetings and highlights which sessions consistently have low or uncertain attendance.
A high number of declined or unanswered invites often signals poor scheduling habits, unclear meeting value, or invite fatigue. If people aren’t responding, or skipping entirely, it’s a warning sign that something’s off with how meetings are being set up.
Low acceptance rates can also point to overloaded calendars or disconnection between the invite list and the meeting’s actual purpose.
Monitoring RSVP trends allows teams to:
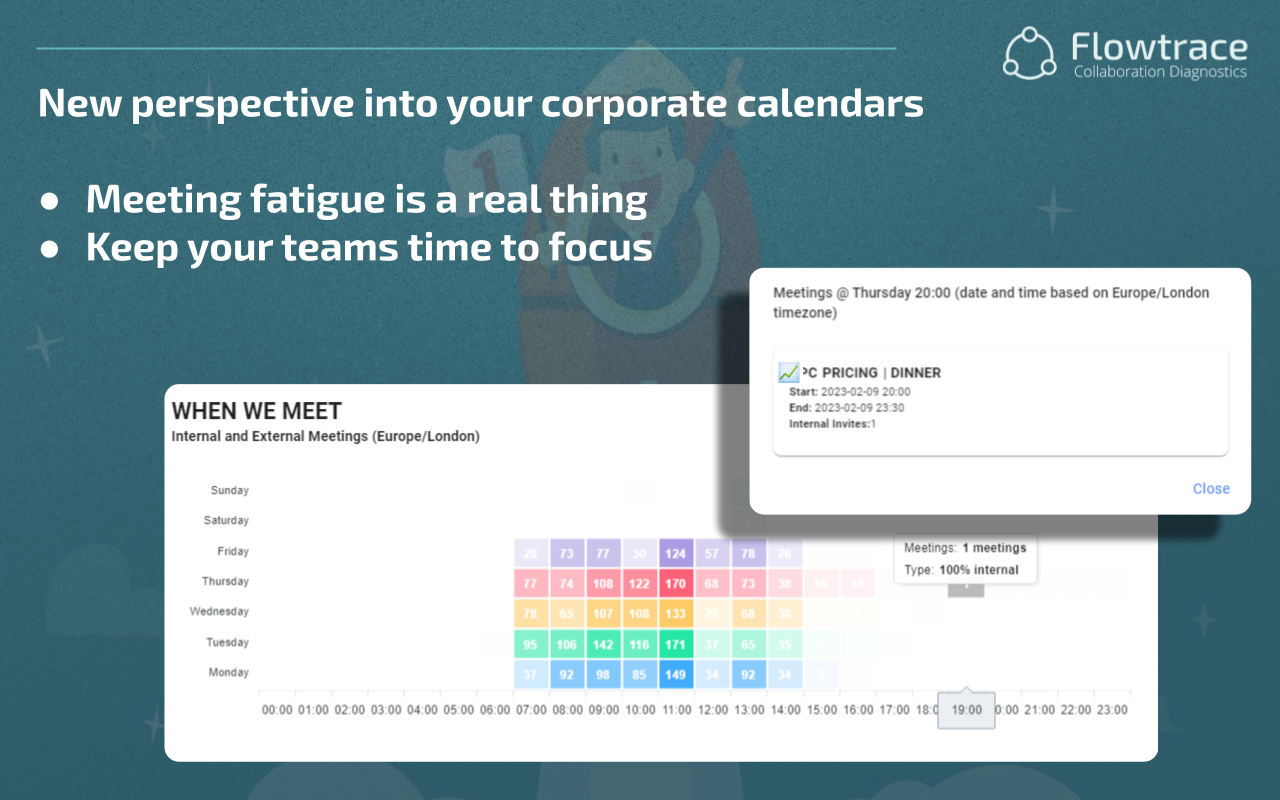
Meeting timing analysis shows when meetings are scheduled across the day and week. It creates a heatmap view of your organization’s meeting behavior, highlighting which hours are overloaded and where there may be opportunities to protect time for deep work.
When meetings stack into the same hours, like mid-mornings or right after lunch, it creates cognitive fatigue and scheduling bottlenecks. Over time, this makes calendars harder to manage and reduces the effectiveness of both meetings and independent work.
Poor timing can also impact team energy. Meetings during low-focus hours (early morning, late afternoon, end of week) often result in lower participation and slower decisions.
Timing data helps companies:
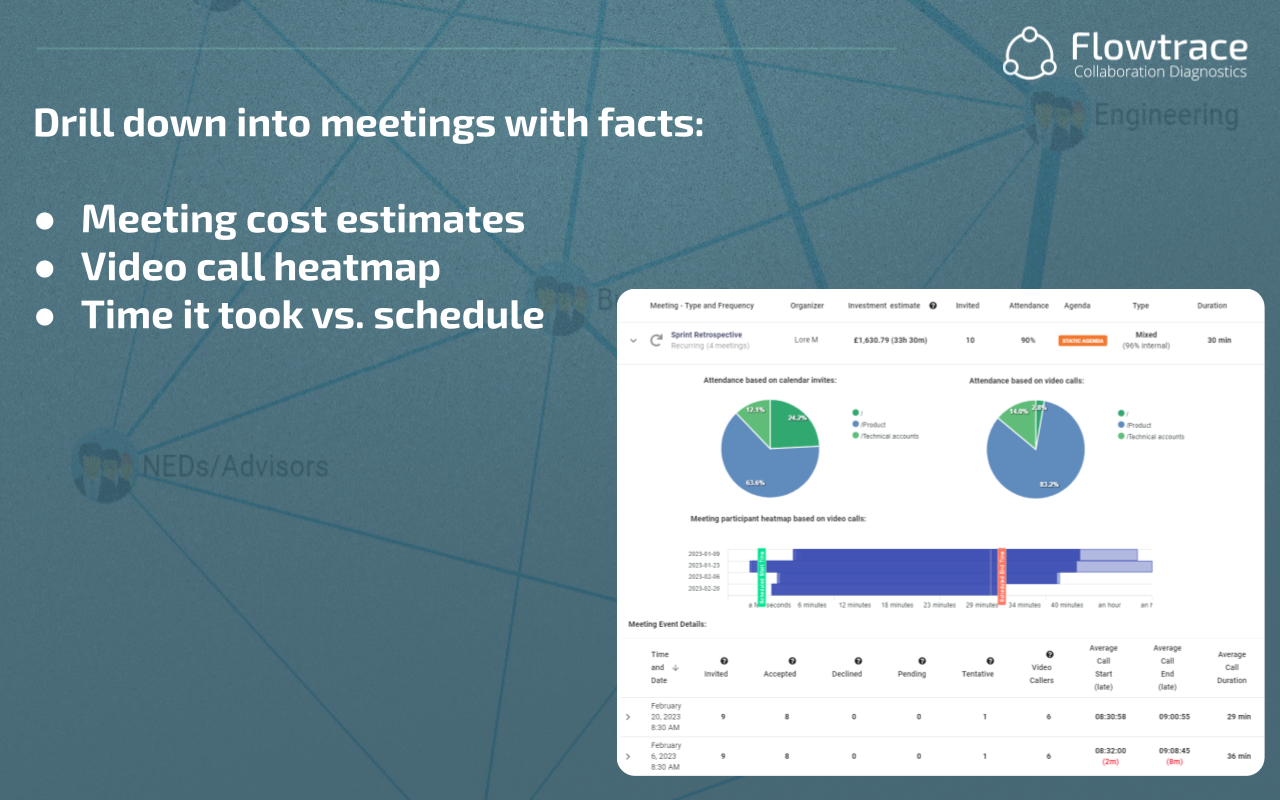
Video meeting analytics measure how much time your team spends on video calls, how long they last, how often they happen, and how frequently they start late. It applies to internal syncs, external calls, and recurring video sessions.
Video calls are essential for hybrid teams, but they come with a cost. Too many video meetings, especially when long or back-to-back, lead to fatigue and disengagement. Without tracking video load, it’s easy to slip into a schedule that burns people out.
Excessive screen time also reduces flexibility, making it harder to blend async work into the week.
By understanding video usage, teams can:

Meeting load analysis breaks down total meeting time by department, role, or job level. It helps you see how time is distributed across the company and whether that distribution aligns with how teams are meant to work.
Some roles, like executives or client-facing staff, will naturally spend more time in meetings. But when certain teams or individuals consistently carry an outsized load, it can affect productivity, morale, and output. Without visibility, these imbalances often go unnoticed.
Meeting load can also reveal gaps in delegation, inefficiencies in planning, or bottlenecks in cross-functional collaboration.
Tracking this data lets organizations:
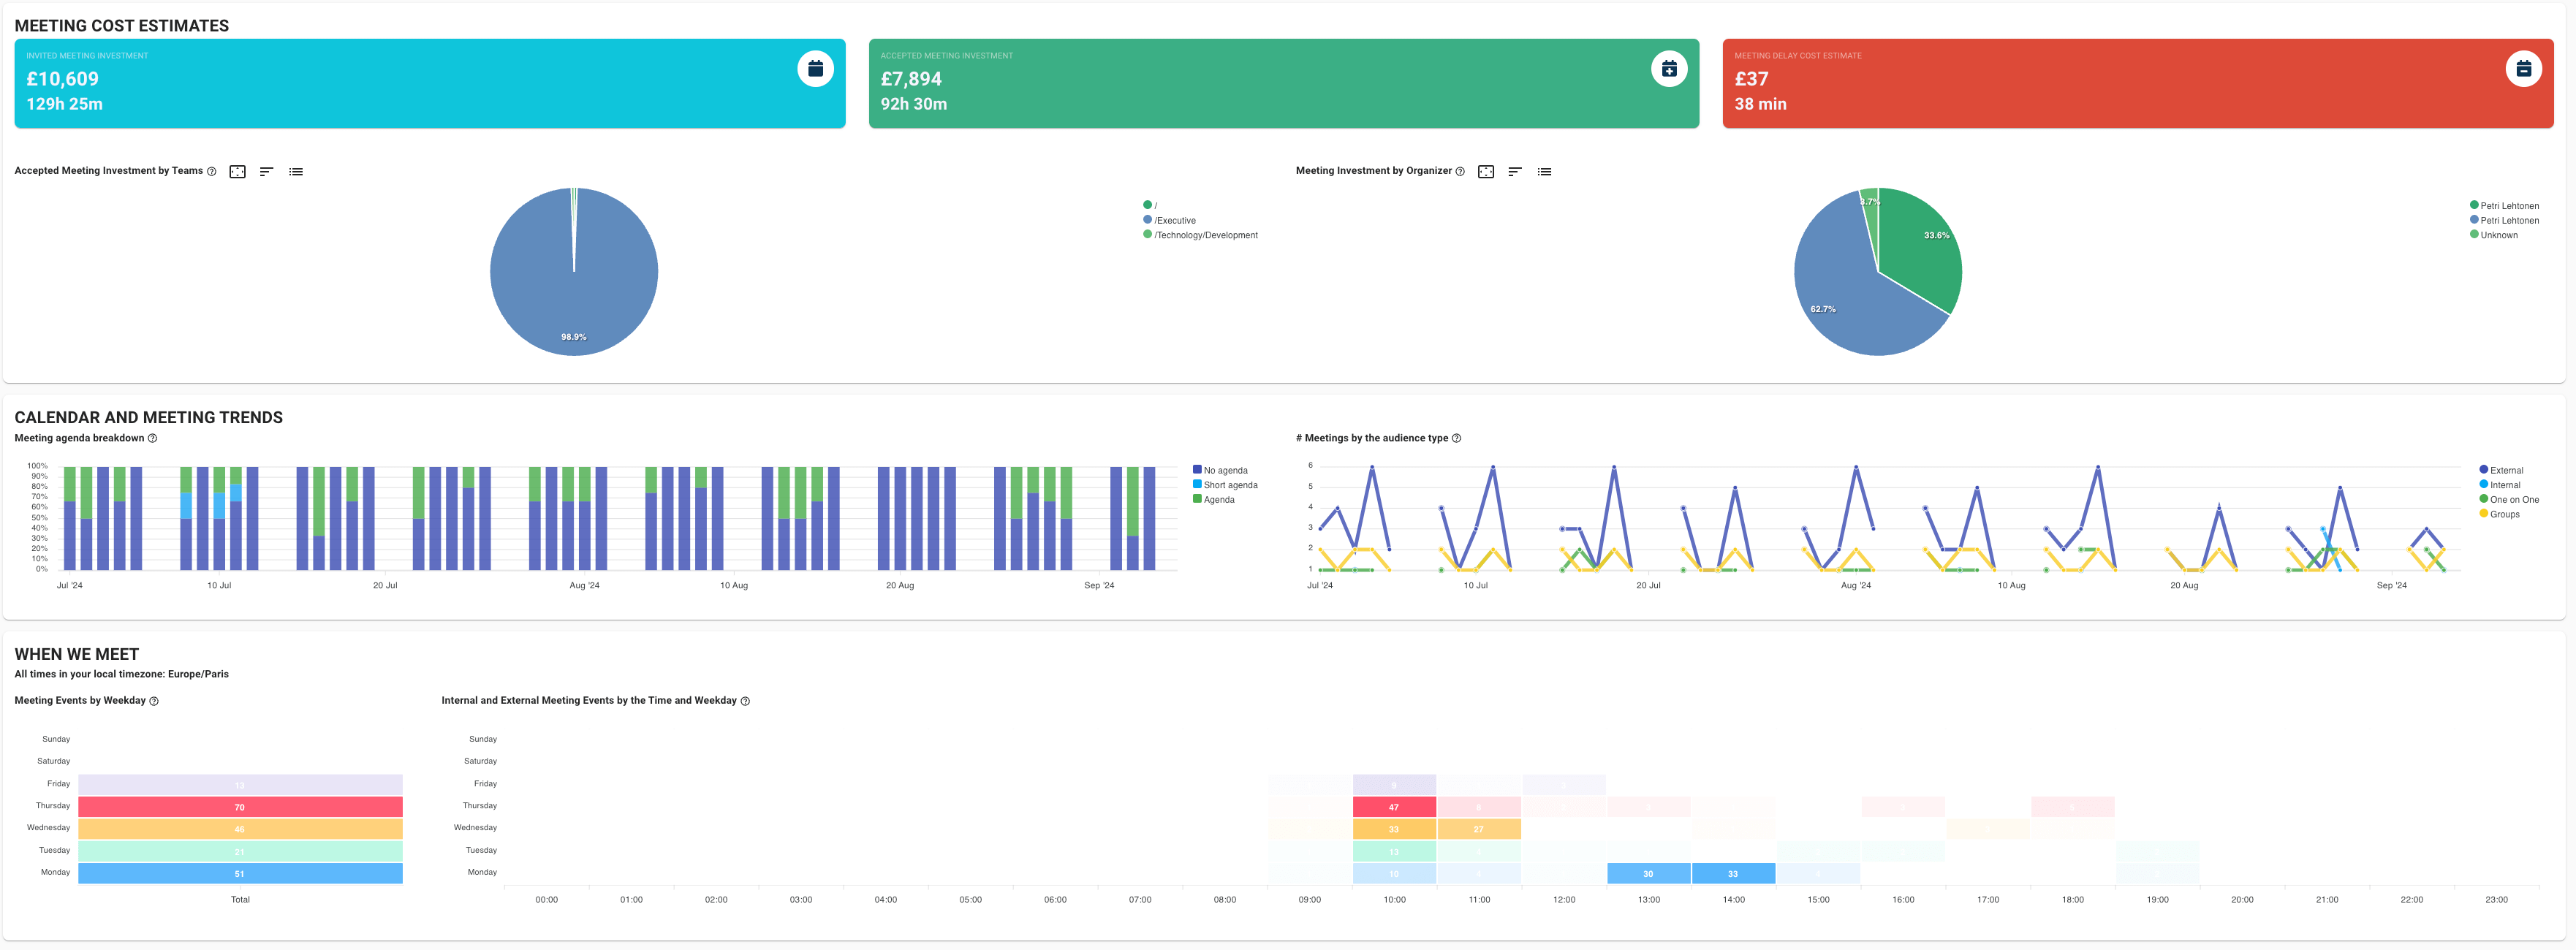
All of the analytics above come directly from Flowtrace’s meeting analytics. Integrated with Google and Outlook calendars, among other tools Flowtrace automatically aggregates and visualizes these data points, turning raw calendar activity into actionable insights.
Flowtrace makes it possible to:
Whether you’re trying to reduce wasted time, free up team focus, or create a culture of better meetings, Flowtrace gives you the data you need to lead that change.
Meetings are unavoidable, but unproductive meetings don’t have to be. The companies that win back their time aren’t doing fewer meetings by accident. They’re using data to make better choices.
By tracking the right meeting analytics, you can shift away from guesswork and toward a more efficient, intentional meeting culture. When you measure it, you can manage it, and that’s where better meetings begin.
Optimize meetings with these meeting cost plugins for Google Calendar and Microsoft Outlook. Gain real-time cost insights to schedule smarter and...
Optimize your meetings with effective meeting invite rules. Learn best practices for clear objectives, detailed agendas, and efficient scheduling to...
Optimize your meetings with a Google Calendar Dashboard and Flowtrace integration. Gain actionable insights into time usage, meeting costs, and...