Scrum teams rarely lose flow because they forgot to track enough numbers. They lose it because work waits in queues, blockers stay hidden, priorities move during the sprint, and calendars slowly become the place where every uncertainty is resolved.
That is why Scrum flow metrics matter. They show whether work can move from idea to shipped value without too much waiting, rework, handoff, or interruption. The useful question is not "how busy is the team?" It is "what in the system is making useful work harder than it needs to be?"
For engineering and product leaders, the strongest view combines three kinds of evidence: delivery metrics from the work system, developer feedback from the team, and meeting analytics from the calendar. Delivery data shows where work slows down. Team feedback explains what the numbers miss. Meeting data shows whether the operating rhythm gives people enough focus time to fix the problem.
Key takeaways
- Scrum flow metrics should improve the system, not score individual developers.
- Cycle time, throughput, work in progress, work item age, blocked time, and DORA delivery metrics each answer a different question.
- Meeting load is part of engineering flow because meetings create interruptions, handoffs, decision latency, and context switching.
- The best Scrum metric review asks what to remove, replace, shorten, improve, or govern.
- Flowtrace helps teams inspect meeting patterns with metadata-first analytics. It does not need to record, transcribe, or analyze meeting conversations.
Contents
What Scrum flow metrics should tell you
Scrum flow metrics should tell you how work moves through the team. They should not become a proxy for who worked hardest.
That distinction matters. The SPACE framework for developer productivity, based on research from Nicole Forsgren, Margaret-Anne Storey, Chandra Maddila, Thomas Zimmermann, Brian Houck, and Jenna Butler, argues that developer productivity is multidimensional: satisfaction and well-being, performance, activity, communication and collaboration, and efficiency and flow all matter. The original ACM Queue article on SPACE also warns against reducing productivity to one activity number.
Scrum teams should take the same lesson. A healthy metric set creates tension between speed, quality, collaboration, and focus. If cycle time improves while defects rise, the system may be cutting corners. If throughput rises while focus time collapses, the team may be brute-forcing delivery through longer hours and more interruptions. If meeting volume rises every time work becomes uncertain, the team may be solving information-flow problems by putting more time on the calendar.
Good flow metrics make those tradeoffs visible.
The metrics that matter
Use a small set of metrics that answer different questions. More numbers do not automatically create better decisions.
| Metric |
What it answers |
What to inspect when it changes |
| Cycle time |
How long does work take from start to finish? |
Queues, handoffs, review delay, unclear acceptance criteria, meetings that split focus time |
| Throughput |
How much finished work moves through the system? |
Batch size, scope churn, team capacity, recurring meetings crowding out delivery work |
| Work in progress |
How much work is open at once? |
Too many parallel commitments, sprint overloading, blocked work hidden as "in progress" |
| Work item age |
Which items are getting stale before completion? |
Blockers, missing decisions, dependency waits, review bottlenecks |
| Blocked time |
How much time is work waiting on someone or something? |
Cross-team dependencies, slow decisions, unavailable stakeholders, missing product clarity |
| Focus time |
Does the calendar leave room for deep work? |
Fragmented days, recurring meetings, overloaded collaboration windows |
| DORA delivery metrics |
Can the team deliver software safely and reliably? |
Deployment friction, change lead time, change failure, recovery, rework |
DORA's software delivery metrics are useful because they connect flow to delivery outcomes, not just task movement. DORA now frames delivery performance around throughput and instability, including change lead time, deployment frequency, failed deployment recovery time, change fail rate, and deployment rework rate. Just as importantly, DORA warns against making metrics into goals, comparing teams without context, or focusing on measurement at the expense of improvement.
Scrum.org's guide to four key flow metrics for Scrum events is a helpful starting point for Scrum teams because it connects flow back to the actual events teams already run. The point is not to create a separate metrics theatre. The point is to make sprint planning, daily Scrum, review, and retrospective more honest.
How meetings distort engineering flow
Scrum ceremonies are not the enemy of flow. Badly governed meetings are.
Daily Scrum, sprint planning, sprint review, and retrospective exist to create coordination. They can reduce ambiguity and unblock work when they are run well. The trouble starts when every uncertainty becomes another recurring meeting, every cross-team dependency becomes a status call, and every delayed decision becomes a calendar invite with more people than needed.
That is when engineering flow gets distorted:
- A developer gets two hours of calendar gaps but no real focus block.
- A blocker waits three days because the right decision meeting is full of people who cannot decide.
- A sprint review becomes a status broadcast instead of stakeholder feedback.
- A retrospective creates action items that no one can see again after the meeting.
- Cross-team coordination spreads across Slack threads, Jira comments, documents, and calls with no shared signal of what changed.
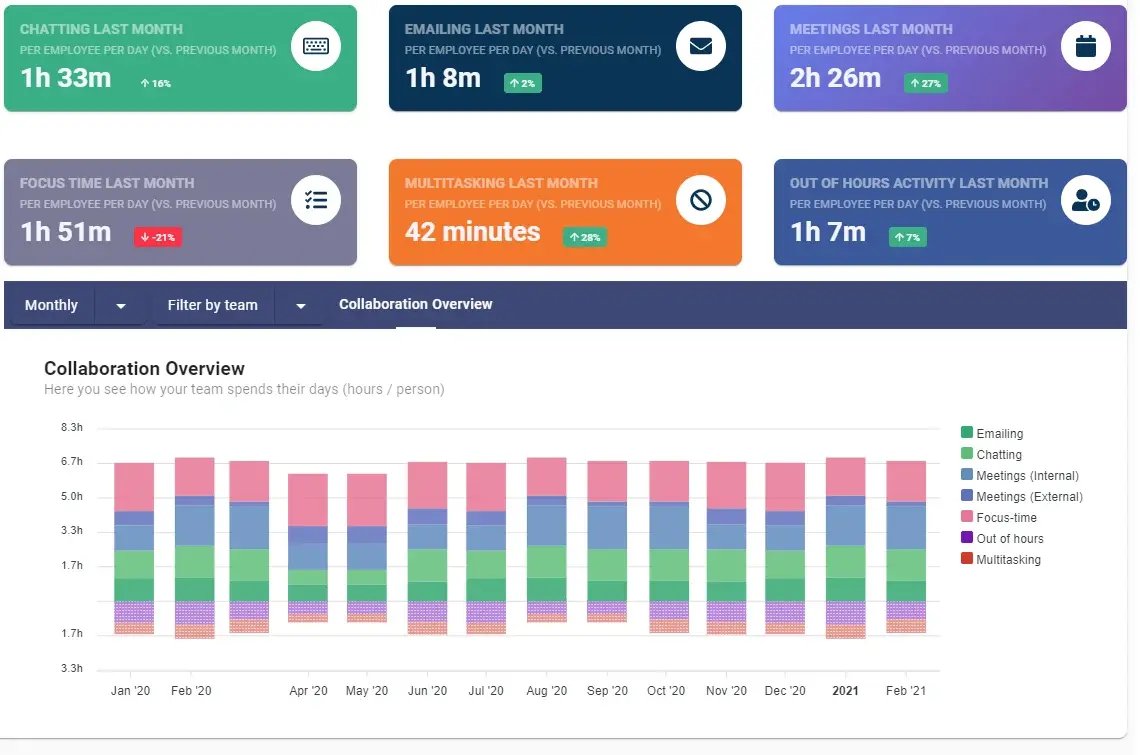
This is why focus time and meeting behavior belong beside Scrum metrics. Cycle time might show that work is slow. Meeting analytics can show whether the team has enough uninterrupted time to move the work, whether decision meetings are overloaded, and whether recurring meetings have grown beyond their original purpose.
Research on Scrum team effectiveness supports the same systems view. Christiaan Verwijs and Daniel Russo's study of Scrum team effectiveness found that team effectiveness depends on factors such as responsiveness, stakeholder concern, continuous improvement, team autonomy, and management support. Those are not individual activity metrics. They are conditions around the team.
If the conditions are poor, a burndown chart will not rescue the sprint.

A practical improvement loop
The improvement loop should be simple enough for a Scrum Master, engineering manager, or product leader to run monthly.
1. Start with a baseline
Pull the delivery data you already trust: cycle time, throughput, WIP, work item age, blocked time, review delay, deployment frequency, and defects or rework. Then add calendar data: meeting load, recurring meeting time, focus time, attendance patterns, meeting size, and late starts.
Do not overfit the first month. The baseline is a conversation starter.
2. Separate symptoms from causes
Slow cycle time is a symptom. So is low throughput. The causes might be unclear requirements, overloaded reviews, too many parallel projects, fragile deployments, missing stakeholder access, or fragmented calendars.
This is where a combined view helps. If work item age is rising and the same team also has very little focus time, the team may not need another process workshop. It may need fewer interruptions, smaller batches, clearer ownership, or better meeting rules.
3. Review Scrum events as working meetings
Look at each Scrum event and ask what job it performs:
- Sprint planning should make scope and tradeoffs clear enough to start work.
- Daily Scrum should surface coordination needs, not become a manager status report.
- Sprint review should test whether the increment creates stakeholder value.
- Retrospective should create one or two improvements the team can actually inspect later.
If an event no longer performs its job, redesign it before adding another meeting. Flowtrace has a related guide on enhancing remote Scrum ceremonies with meeting health KPIs that is useful when ceremonies have become routine but not very effective.
4. Protect focus time before asking for more output
Engineering work needs long enough blocks for design, coding, review, debugging, and testing. If the calendar is fragmented, the team may appear responsive while becoming slower at the work that matters.
Start by checking whether engineers have predictable focus blocks, whether meetings cluster intelligently, and whether recurring meetings are still earning their place. For teams with heavy meeting load, leveraging meeting analytics to increase deep work time is often more useful than another velocity target.
5. Reduce work in progress
High WIP often looks like ambition. In practice, it creates queues and delayed decisions.
Use WIP metrics to ask what the team should stop starting. Then use meeting data to inspect the coordination cost of too much parallel work. If every active project needs its own status meeting, dependency meeting, planning meeting, and review meeting, the calendar is showing the cost of WIP before the delivery dashboard does.
6. Govern meeting behavior at the point of scheduling
Meeting policies fail when they live in a document and never touch the moment a meeting is created. Teams need practical rules at the point behavior happens.
Good examples:
- Large meetings need a clear purpose and owner.
- Recurring meetings need a review date.
- Meetings over a certain length need an agenda.
- Decision meetings need the required decision maker, not just a long attendee list.
- Focus blocks should not be casually overwritten.
Flowtrace supports this kind of behavior change with meeting governance and calendar-side nudges. For tactical examples, see meeting invite rules best practices, Google Calendar rules for productive meetings, and Flowtrace's Google Calendar and Outlook meeting cost and validation rules.
7. Inspect again and keep the useful changes
After a month, compare the baseline with the new pattern:
- Did cycle time improve without hurting quality?
- Did work item age fall?
- Did blocked time become easier to explain?
- Did focus time increase?
- Did recurring meeting load fall or become more intentional?
- Did sprint events create clearer decisions?
One improvement is enough. The point is to create a learning loop, not a dashboard that everyone learns to ignore.
Where Flowtrace fits
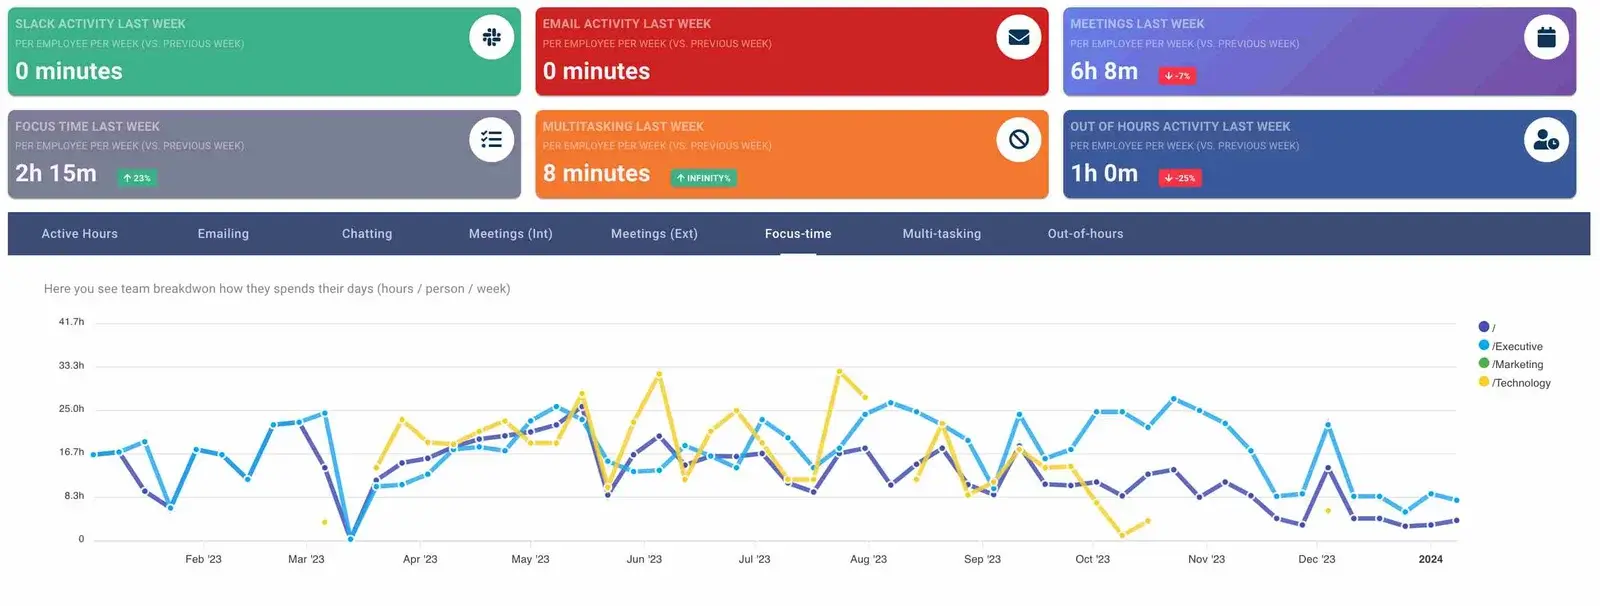
Flowtrace is useful when engineering flow problems are partly caused by the meeting system around the team.
It does not replace Jira, GitHub, GitLab, CI/CD dashboards, or DORA reporting. Those systems show the movement and quality of software work. Flowtrace shows the calendar and meeting patterns that shape whether people have time, clarity, and governance around that work.
For engineering leaders, that means you can connect questions such as:
- Are sprint ceremonies consuming more time than they return?
- Are recurring meetings crowding out focus time?
- Are decision meetings too large, too frequent, or missing the people who can decide?
- Are specific teams carrying more meeting load than others?
- Are meeting rules changing behavior after a policy is announced?
Because Flowtrace is metadata-first, it can analyze meeting load, recurrence, cost, attendee patterns, focus time, and scheduling behavior without reading meeting content. That privacy boundary matters. The goal is not to monitor engineers. The goal is to remove friction from the system around them.
For teams building an executive view, meeting analytics for executive decisions, implementing a meeting analytics dashboard, and how to make data-driven meeting improvements are useful next reads.
Common mistakes
Percentage of AI-generated code
One of the most common mistakes we're starting to see in 2026 is measuring engineering teams by how much of their code was generated by AI. It's really just the old "lines of code" metric with a new name.
We learned this lesson back in the 80s and 90s. More code means more to review, more to test, more to maintain, and ultimately more opportunities for bugs. AI has made writing code dramatically faster, but it hasn't made maintaining that code any cheaper.
As Edsger Dijkstra famously put it, lines of code should be treated as lines spent, not lines produced. AI hasn't changed that principle.
Using metrics to rank teams
Comparing teams by cycle time or throughput without context creates bad incentives. A platform team, product squad, support-heavy engineering group, and experimental R&D team do different work. Use metrics to improve each system, not to turn teams into a league table.
Treating meetings as separate from delivery
Meetings are part of the delivery system. They create decisions, interruptions, handoffs, alignment, and rework. Ignoring meeting data leaves a blind spot in any flow review.
Optimizing activity instead of outcomes
More tickets closed does not automatically mean more customer value. More meetings does not automatically mean better collaboration. Better Scrum metrics should connect activity to outcomes, quality, and developer experience.
Adding dashboards before changing behavior
A dashboard can show the problem. It cannot fix the operating habit by itself. Teams still need meeting rules, ownership, smaller batches, clearer decisions, and a regular inspect-and-adapt loop.
FAQ
What are Scrum flow metrics?
Scrum flow metrics are measures that show how work moves through a Scrum team's system. Common examples include cycle time, throughput, work in progress, work item age, and blocked time. They help teams find bottlenecks and improve the way work flows through planning, development, review, and release.
Which Scrum flow metric should we start with?
Start with cycle time and work item age if you need to find where work is slowing down. Add WIP if too much work is open at once, and add focus time if the team is struggling with interruptions. Use DORA metrics when you also want to connect flow to production delivery.
Should Scrum teams measure meetings?
Yes, if meetings are affecting focus time, decisions, handoffs, or delivery speed. The goal is not to eliminate Scrum ceremonies. The goal is to make sure meetings create clarity and unblock work rather than fragmenting the day.
How does Flowtrace help with Scrum flow metrics?
Flowtrace adds meeting and calendar context to engineering flow analysis. It helps leaders see meeting load, recurring meeting patterns, focus time, meeting cost, and scheduling behavior. That makes it easier to identify which meeting habits are helping delivery and which ones need to be removed, shortened, redesigned, or governed.
Build the system around the team
Scrum metrics are useful when they help people see the system clearly. They become harmful when they are used as a shortcut for judgment.
For engineering teams, flow is not only what happens inside Jira or the deployment pipeline. It is also what happens around the work: the meeting load, the decision rhythm, the quality of stakeholder input, the amount of focus time, and the rules that make good behavior easier.
Start there. Measure enough to see the pattern, change one constraint, and inspect the result. That is where Scrum metrics become team insight instead of management theatre.