Meeting Governance
Meeting Policy Guide: Rules, Governance, and Rollout
Learn how to create a meeting policy, set meeting rules, govern calendars, and use analytics to make better meeting habits stick.
Learn how calendar analytics measures meeting load, focus time and schedule fragmentation, and how leaders turn calendar patterns into action.
A calendar looks factual. The meeting starts at 10:00, lasts 60 minutes and has eight people invited. The problem starts when we treat those facts as proof that eight people attended, the meeting lasted an hour, the time was useful, or the open space around it was productive.
I have seen companies make all four assumptions. They usually begin with a reasonable question: "How much time are we spending in meetings?" Then calendars get complicated. Recurring series, declined invites, double bookings, time zones, private events and different job roles quickly turn one number into an argument about definitions.
Calendar analytics is the analysis of calendar event metadata to understand how scheduled work is allocated and shaped. It can show meeting load, recurrence, usable focus blocks, overlaps, notice time, attendee reach, workday boundaries and trends. It cannot prove productivity or meeting quality on its own.
That distinction is the foundation of useful calendar analysis. The calendar makes otherwise invisible patterns of work visible. Leaders still need to ask what caused the pattern, whether it matters in context and what decision should change.
Calendar analytics, also called calendar analysis, turns event metadata into patterns that an individual, team or organization can inspect. Typical fields include event start and end times, scheduled duration, recurrence, organizer, invitees, RSVP status, working hours, time zone and optional event classifications.
At an individual level, the question might be: "How much of my week is in meetings?" At an organization level, the questions become harder and more useful:
The company-level view matters once the calendar has more recurring series, teams and ownership patterns than one manager can inspect manually. It also changes the ethical boundary. Personal calendar reflection can be private. Organization-level analysis needs a declared purpose, consistent calculations, aggregation and controlled access.
Calendar data is strong evidence of scheduled commitment. It shows when people intended to meet, who was invited, how the event was configured and how those commitments are distributed over time.
It can reveal:
It cannot prove:
Microsoft WorkLab's 2025 analysis of aggregated Microsoft 365 signals makes this limitation visible. Its often-quoted interruption figure combines meeting invites, emails and chats, and applies to the top 20% of users by ping volume. Much of the fragmentation people experience never appears as a calendar event.
The practical rule is simple: use the calendar to locate a pattern, then use the right evidence to understand it. That may mean event-level review, call attendance, employee feedback, workflow data, delivery outcomes or meeting analytics.
These categories overlap, but they answer different questions.
| Layer | Main question | Typical scope | What it misses on its own |
|---|---|---|---|
| Native time insights | How is my calendar or work pattern distributed? | Individual or bounded team view inside Google or Microsoft | Company-wide diagnosis, cross-platform governance and custom definitions may be limited |
| Calendar analytics | What is the calendar doing to the workday across teams? | Allocation, shape, recurrence, boundaries and trends | Meeting quality and outcomes need other evidence |
| Meeting analytics | Are meetings designed, attended and governed well? | Cost, attendance, purpose, agenda, punctuality, recurrence and effectiveness signals | It should not require recording or transcript analysis by default |
| Time tracking | What work was logged against activities or projects? | Recorded effort and project allocation | Scheduled collaboration and organization-wide calendar patterns may be incomplete |
Google Calendar Time Insights and Microsoft Viva Insights are useful examples of the first layer. Flowtrace operates across the second and third layers with metadata-first analytics, then connects the result with calendar-side rules and prompts. It does not need to record, transcribe or interpret meeting conversations.
For a deeper category explanation, read Calendar Analytics vs Meeting Analytics.
Long metric lists encourage people to pick the number that confirms what they already believe. A better approach is to read the calendar through five lenses. These are not maturity levels or a score. Each lens answers a different management question.
| Lens | The question | Useful measures | Common mistake |
|---|---|---|---|
| Load | How much time has the calendar committed? | Meeting hours, count, share of working time, recurring share | Treating every role as if it needs the same meeting level |
| Shape | Is the remaining time usable? | Focus-block length, short gaps, back-to-backs, overlaps, density | Counting every open minute as focus time |
| Commitments | What keeps returning or expands the burden? | Recurrence, notice time, attendee reach, organizer and response patterns | Calling recurrence or a large audience waste without checking purpose |
| Boundaries | Where does the calendar cross working constraints? | Early, late and after-hours meetings, time zones, role differences | Using headquarters time as the only valid workday |
| Change | Did an intervention improve the pattern? | Before-and-after trends, rule adoption, recurrence changes, counter-metrics | Claiming a business outcome because a calendar number moved |
Start with meeting hours and meeting count, but keep the denominator visible. Ten hours of meetings means something different in a 20-hour working week, a 40-hour week and a role where client meetings are the work.
Useful load measures include:
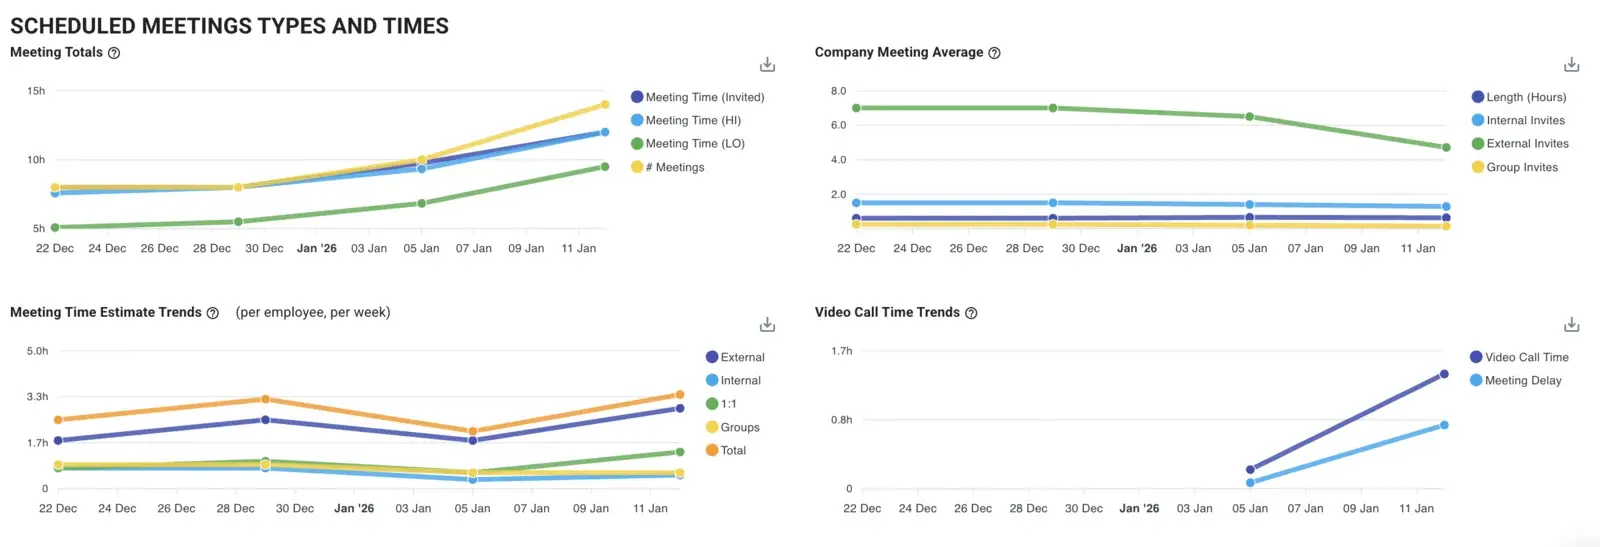
The denominator choice must stay stable across periods. If one dashboard counts every invitation and another counts only accepted Busy events, the trend may change because the definition changed, not because the company changed.
Two people can both have four hours of meetings and experience completely different days. One has a clean morning for demanding work and four meetings together in the afternoon. The other has four meetings placed across the day with 20-minute gaps between them.
Both calendars contain four open hours. Only one contains a long, usable block.
Calendar shape measures should include:
Peer-reviewed research by Zhang, Spreitzer and Qiu helps explain why placement matters. Across two experience-sampling studies with 245 and 167 workers, a greater share of a work period spent in meetings relative to individual work was associated with fewer replenishing microbreaks, which in turn harmed energy. The study does not give every company a universal focus-time target. It shows why total hours alone miss part of the workday design.
Our guide to protecting focus time goes deeper into the difference between a free calendar and a usable one.
Recurring meetings deserve their own view because one scheduling decision can repeat for months. The first meeting may be useful. The 40th can remain because cancelling a series feels harder than creating it.
In Flowtrace's 2026 meeting statistics, based on more than 1.2 million scheduled meetings from 2025, 48.5% of meetings were recurring. Among meetings, 36.3% were organized with less than 24 hours' notice. Neither number is a universal target. Together they show why recurrence and reactive scheduling should be visible instead of buried inside the total.
Inspect:
Do not call a recurring series waste because it is recurring. Ask whether the purpose still exists, whether the frequency matches the work and whether everyone needs the full meeting.
An organization-wide average can hide the people who absorb the edges of the workday. A London team may see reasonable afternoon meetings while colleagues in another time zone repeatedly receive the early or late slot.
The mixed-methods Rhythm of Work study combined interviews, a survey of 165 people and telemetry from millions of meetings scheduled by 211,000 workers. It found that scheduling preferences and actual practice can diverge, with meeting load, time zones, job function and job title helping explain the differences.
That is why boundary analysis should cover:
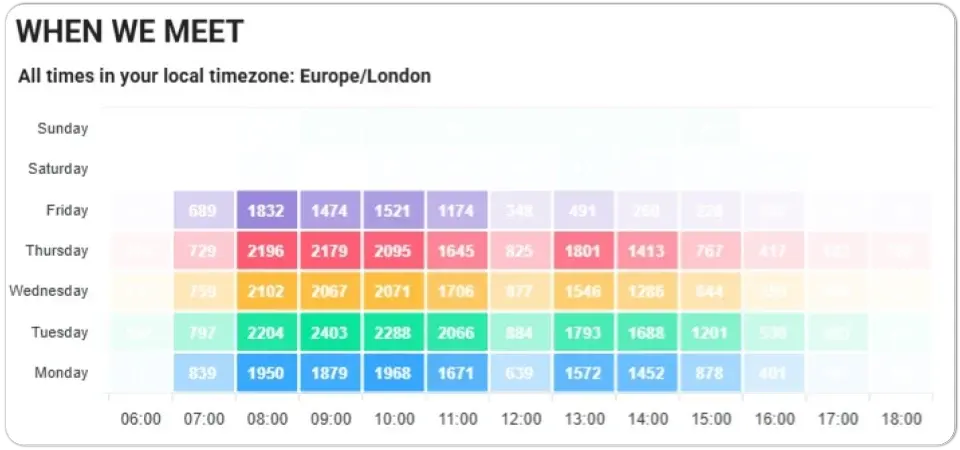
A heatmap is useful because it makes concentration and edge hours visible. It still needs the correct time-zone conversion and a clear denominator. In Flowtrace's 2026 statistics work, Tuesday represented 21.8% of meetings with weekday data, but the aggregate export did not include time-zone information. That makes the pattern useful for asking where meetings concentrate, not for declaring Tuesday universally overloaded.
A dashboard that never changes a decision is reporting, not management.
The Change lens compares a trusted baseline with what happened after a bounded action. Examples include:
Measure the intended metric and a counter-metric. If meeting hours fall but decision time, rework or employee frustration increases, the intervention did not improve the work. It moved the cost.
Companies often ask for a healthy meeting percentage before they have agreed what counts as a meeting.
I understand why. A benchmark feels decisive. In practice, a universal number usually creates a false contest between roles that were never comparable. Recruiters have interviews and candidate debriefs. Customer teams meet clients. Engineering teams need long blocks for implementation. Executives carry cross-company decisions. International teams have limited overlap windows.
A healthy calendar is not a fixed percentage. It gives each role enough usable time for its work, makes collaboration commitments visible and improves when the organization changes a scheduling habit.
Build interpretation in this order:
Platform definitions show how quickly results can diverge. Google Calendar Time Insights counts accepted Busy meetings with at least one other guest and a duration below eight hours, applies specific overlap rules, and distinguishes planned focus time from remaining time. Microsoft Viva Insights uses its own rules for working hours, overlap, notice, RSVP and meeting exclusions, including private and all-day meetings.
Neither definition is wrong. They answer a defined product question. Problems start when a leader compares two numbers without comparing the rules behind them.
Calendar analytics should lead to a question, not a verdict.
| Signal | Possible explanation | Question to ask | Next action |
|---|---|---|---|
| Recurring meeting load keeps rising | New series are created but old ones are rarely reviewed | Which series still produces a decision, output or necessary coordination? | Run a recurring-meeting review by owner and purpose |
| Meeting hours are moderate but focus blocks disappear | Meetings are distributed across the day | Which gaps are usable for the role's core work? | Cluster or move selected meetings and compare block length |
| Long back-to-back runs | Calendar availability is being optimized without recovery time | Are transitions, preparation and breaks realistic? | Add buffers or change scheduling defaults |
| After-hours load falls repeatedly on one region | Time-zone convenience is not being rotated | Who carries the edge hours, and can the burden move? | Set shared overlap hours or rotate recurring slots |
| Short-notice meetings are increasing | Work is reactive, ownership is unclear or teams use meetings for escalation | Which meeting types create the pattern? | Fix the upstream workflow or add a notice rule with exceptions |
| A meeting-free day looks successful but other days become denser | Meetings moved rather than disappeared | Did usable focus time increase across the week? | Measure weekly shape, not policy-day meeting count |
| A specialist or leader appears in many meetings | Decision rights or access to expertise may be centralized | Which decisions truly require that person? | Delegate decisions, redesign forums or change attendance rules |
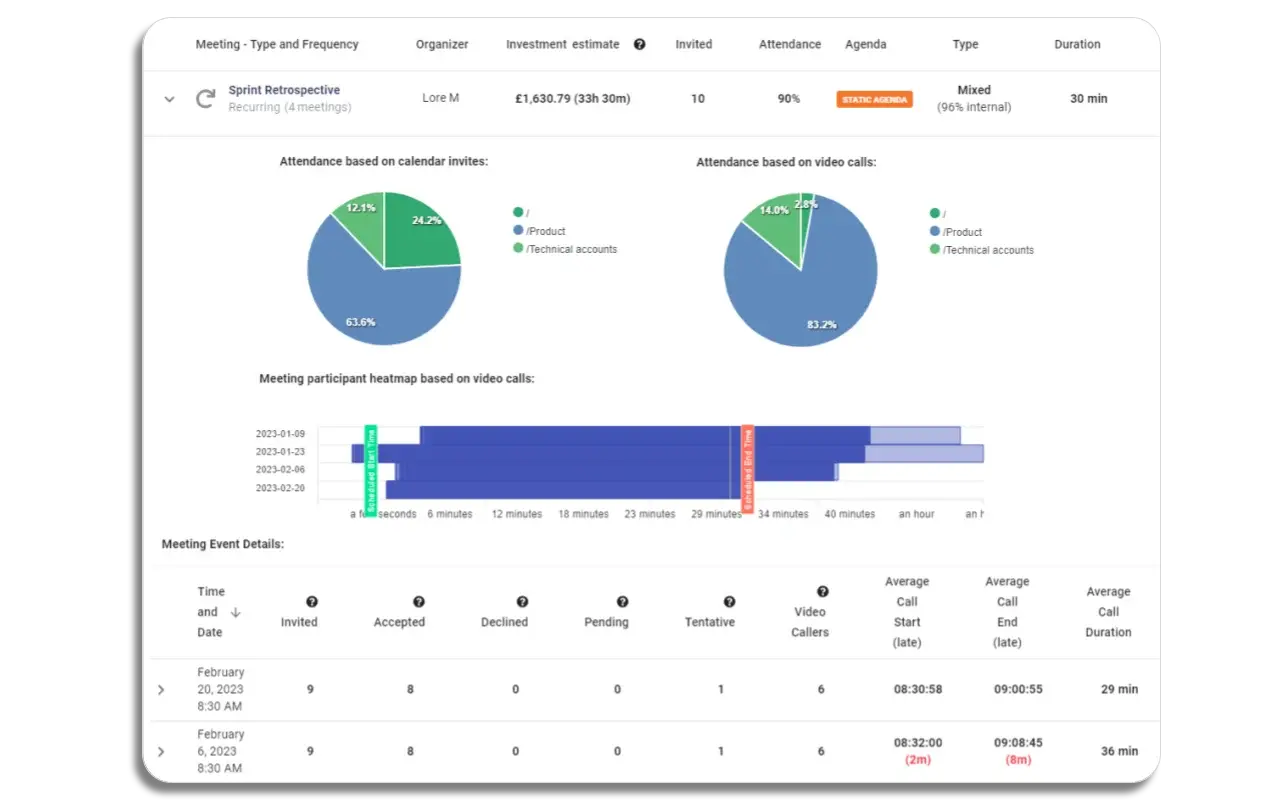
The image above illustrates the necessary move from the company pattern to the meetings behind it. Scheduled and actual call timing, recurrence, invitation status and attendance can tell different stories. Keep those differences visible.
If you need the full data collection and review sequence, use our seven-step calendar audit.
The sequence is straightforward, but an organization needs discipline around the question, the baseline and the change.
Start with a real problem: engineering teams cannot find implementation blocks, a recurring leadership portfolio has grown, cross-time-zone meetings are falling unevenly, or a new policy does not seem to change scheduling.
Choose a representative period and lock the definitions. Record load, shape, commitments and boundaries before changing anything.
Compare relevant roles, teams, meeting types and time zones. Do not average away the operating difference you need to understand.
Review the recurring series, organizers, attendance, purpose and workflow that create the signal. Ask people what the calendar cannot answer.
Remove, replace, shorten, move or redesign a bounded set of meetings. If the behavior is known but easily forgotten, reinforce it when the organizer creates the invite. The Meeting Policy Guide covers ownership, rules and rollout in depth.
Compare the same metrics with the baseline, then inspect counter-metrics and employee experience. Keep the change only if the work improved.
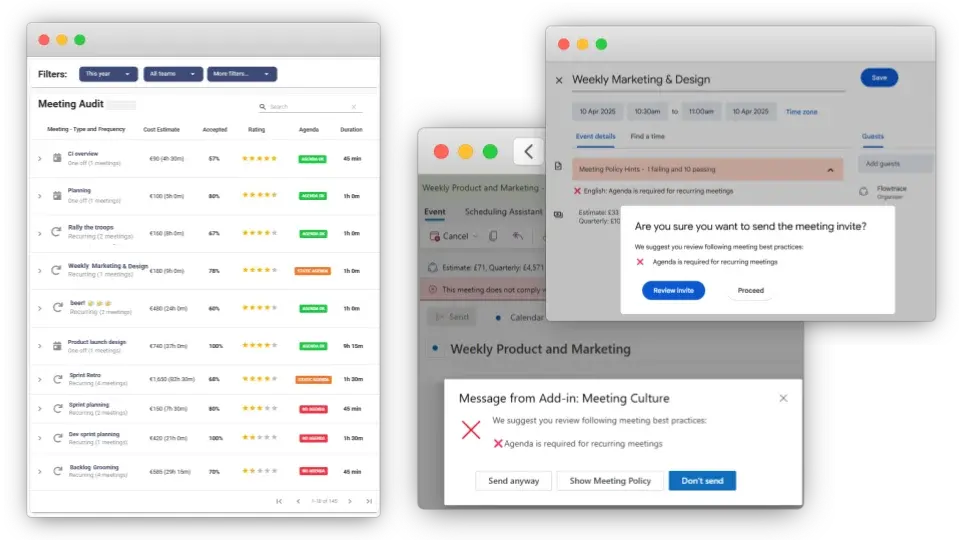
This is the Flowtrace loop: analytics reveals the pattern, calendar-side guidance changes the scheduling decision, and analytics shows whether the change sticks. Flowtrace Calendar Analytics supports that organization-level baseline and verification without reading meeting content.
The same dashboard should not produce the same conversation for every role.
| Role | Calendar question | Useful view | Decision |
|---|---|---|---|
| CEO or COO | Where is coordination consuming capacity or slowing work? | Load, recurrence, cross-team patterns and trend | Set priorities, ownership and operating cadence |
| People or HR | Where do calendar patterns support reports of overload or unfairness? | Role and team load, after-hours patterns, usable focus blocks | Investigate systems without ranking employees |
| IT or collaboration owner | Can definitions, permissions and rules work securely across the calendar environment? | Data coverage, access, aggregation, exclusions and integrations | Set governance and implementation boundaries |
| Engineering or Product leader | Are ceremonies and ad hoc meetings fragmenting delivery work? | Focus-block distribution, density, recurrence and specialist bottlenecks | Redesign cadence and protect usable work blocks |
| Manager | Which recurring meetings should change? | Series-level load, attendance, purpose and calendar shape | Remove, replace, shorten, move or redesign meetings |
| Finance leader | Where does scheduled meeting time create material operating cost? | Attendee-weighted time, recurrence and cost by comparable group | Validate assumptions and prioritize a deeper review |
Executives who need a concise reporting layer can use our guide to the metrics and views in an executive meeting dashboard. Finance readers should use the Meeting Cost Guide for calculation, cost layers and reduction decisions.
Metadata-first analytics does not mean "anything goes." Calendar metadata can still reveal working patterns, relationships and sensitive event context. A responsible program uses the minimum data required for a declared purpose.
Set these boundaries before broad reporting:
Microsoft's Team Insights documentation provides one useful design example: Microsoft states that managers cannot see individual team members' personal collaboration habits in the team view. Flowtrace's privacy boundary is similarly clear at the product level. It uses calendar and meeting metadata and does not need to record or analyze what people say. We aggregate to team, department, or company level to maintain the required privacy compliance.
The goal is to improve the meeting system around employees. It is not to turn calendars into a performance score.
Both calendar ecosystems provide useful native insight. The right starting point depends on the decision.
Google Time Insights helps an individual inspect time breakdown, time in meetings and people met, subject to Workspace availability, admin settings and Google's event rules. It is useful for personal reflection and for understanding how Google defines accepted meetings, overlaps, focus time and remaining time.
For company analysis, governance and Flowtrace implementation, read Google Calendar Analytics for Tech Companies and see the Flowtrace Google Calendar tools.
Microsoft Viva Insights covers personal and team habits such as advance notice, working-hours scheduling, overlap, punctuality, RSVP and attendance, subject to licensing and configuration. Outlook organizations may need to distinguish calendar event data, Teams call data and Viva's inclusion rules before comparing results.
Use our Outlook Calendar Analytics guide for the detailed workflow and see the Flowtrace Outlook tools for calendar-side cost and policy support.
Native tools can be enough for an individual or a bounded use case. A company usually needs a broader layer when it must:
Good software should make interpretation easier, not hide it behind a single score.
Look for these capabilities:
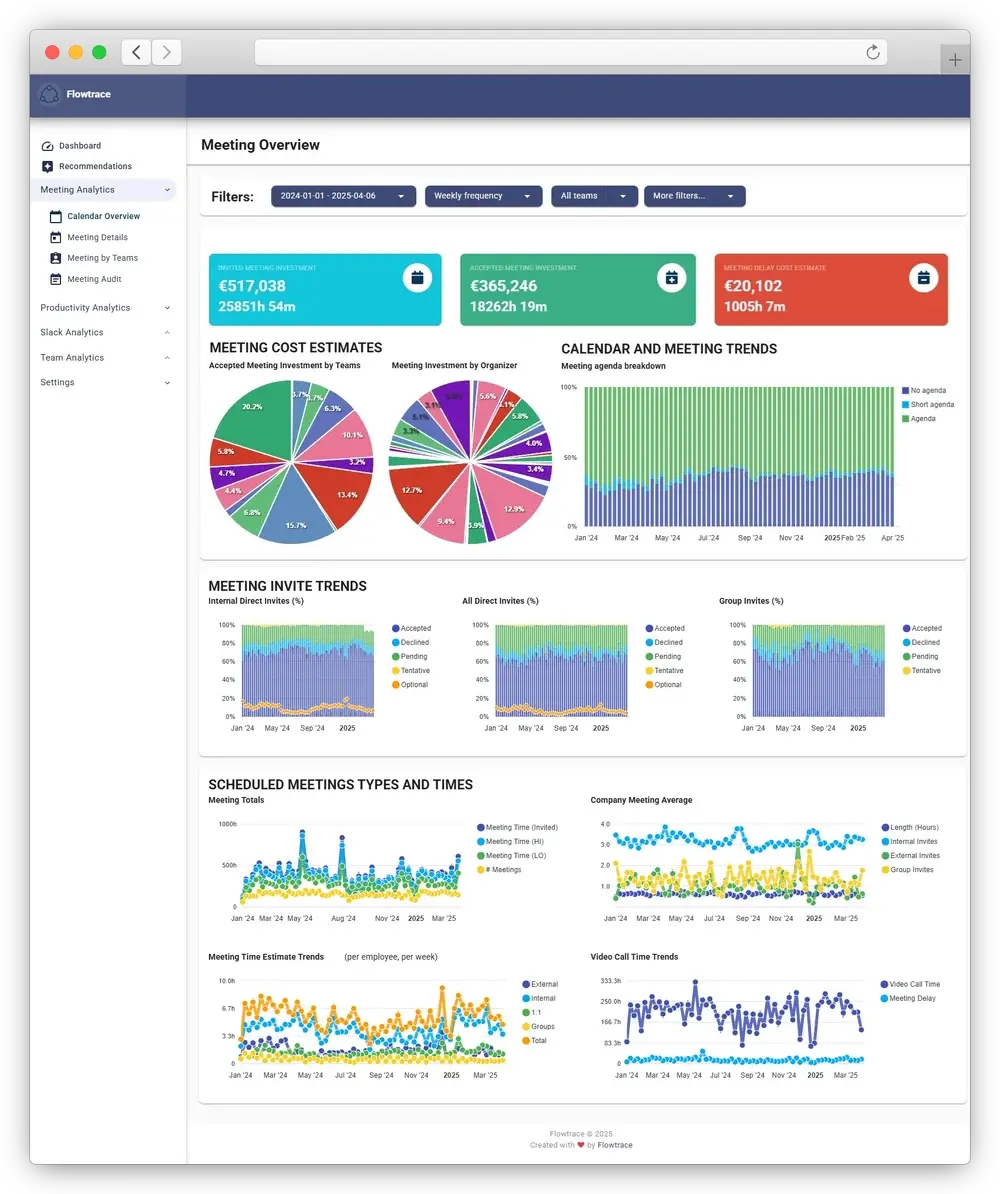
Flowtrace combines organization-level calendar analytics, meeting analytics, meeting cost visibility and calendar-side governance. That is useful when the problem has moved beyond one person's calendar and become part of how the company coordinates work.
If you are evaluating vendors, use 7 Best Calendar Analytics Tools in 2026 for the full comparison criteria and best-fit cases.
Choose the route that matches the question in front of you.
Calendar analytics is the analysis of calendar event metadata to understand how scheduled work is allocated and shaped. It shows patterns such as meeting load, recurrence, usable focus blocks, overlaps, notice time, attendee reach, working-hour boundaries and change over time.
Calendar analytics explains how scheduled commitments shape the workday. Meeting analytics examines the meetings behind those commitments, including cost, attendance, purpose, agendas, punctuality, recurrence and effectiveness signals. Companies often need both views.
Start with meeting hours and meeting count, usable focus blocks, back-to-back and overlapping meetings, recurring share, notice time, after-hours load and trends after a scheduling change. Segment the results by comparable roles, teams and time zones.
Yes. Google Calendar Time Insights and Microsoft Viva Insights provide useful personal or bounded team views with their own inclusion rules. Organization-level analysis may require broader segmentation, governance, cross-platform coverage and change measurement.
Use only the metadata required for the stated purpose, aggregate company and team reporting, restrict access, apply minimum group sizes, explain retention and exclusions, and prohibit individual productivity rankings. Investigate the work system, not the person.
Use a representative baseline and review trends on a regular monthly or quarterly cadence. Measure more frequently during a bounded policy or scheduling experiment, while allowing enough time to separate a real change from weekly noise.
Calendar metadata cannot by itself prove attendance, meeting quality, decision quality, productive focus, employee performance, burnout or business outcomes. Those questions need meeting, workflow, outcome or employee-feedback evidence.
Calendar analytics becomes valuable when it changes how the company coordinates work.
Choose one business question. Agree what the metrics mean. Build a baseline for the roles and teams involved. Investigate the meetings behind the pattern. Change one commitment or scheduling rule. Then inspect the calendar, the work and the employee experience again.
If the number improved but the work did not, keep looking. The goal is not a cleaner dashboard. The goal is a workday that supports necessary collaboration and still leaves people the time their jobs require.

Learn how to create a meeting policy, set meeting rules, govern calendars, and use analytics to make better meeting habits stick.
Learn how to assess and improve meeting culture with employee feedback, privacy-safe calendar data, clear rules and measurable behavior change.
Learn what meeting analytics is, which metrics matter, and how leaders use meeting data to improve meeting culture.