Meetings take up a large share of the workweek. In Flowtrace’s analysis of 1.3 million meetings and 1.75 million hours of meeting time, employees spent about 392 hours per year in meetings. That is roughly 10 full workweeks.
That is why meeting metrics matter.
Without data, companies tend to fix meetings based on opinion. Someone says there are too many meetings. Someone else says meetings are fine, people just need better discipline. Neither view tells you what is actually happening.
Meeting metrics give you a clearer way to measure how meetings affect productivity, focus, decision-making, and cost. They help you see which meetings are useful, which ones are too large, which ones start late, which ones lack structure, and which ones keep showing up on the calendar without creating much value.
At Flowtrace, we see this repeatedly. Most teams do not have a meeting problem in the abstract. They have a design problem. The wrong people are invited. Recurring meetings run longer than they should. One-off meetings are booked too late. Agendas are missing. The calendar gets full, but outcomes stay unclear.
The good news is that this is measurable.
In this guide, we will cover 15 meeting metrics that help companies improve meeting culture. Together, they give you a practical framework for improving meetings across the organization.

What Are Meeting Metrics?
Meeting metrics are measurable indicators that help you evaluate whether meetings are worth the time they consume.
The best meeting metrics do three things:
- They show what is happening now
- They reveal where time or attention is being wasted
- They help leaders decide what to remove, shorten, redesign, or keep
This matters because meeting effectiveness is not just about whether people showed up. A meeting can have perfect attendance and still be a bad meeting. It can start on time and still produce no decision. It can feel busy and still create more follow-up work than progress.
For a practical framework to judge whether individual meetings are actually working, see our guide to meeting effectiveness.
That is why the best meeting measurement combines three layers:
- Efficiency metrics that show time, load, cost, and calendar pressure
- Participation metrics that show whether the right people are involved
- Outcome metrics that show whether the meeting actually moved work forward
If you want a structured way to audit meeting quality and overload together, use our meeting health metrics.
15 Meeting Metrics Every Company Should Track
1. Total meeting hours per employee
This is the foundation metric.

If you do not know how much time people spend in meetings each week, it is hard to judge anything else. Total meeting hours shows the scale of the load. It also helps you spot who is overloaded, which teams are spending the most time in meetings, and whether calendars are leaving enough room for focused work.
Flowtrace’s meeting data shows just how large this issue can become. Employees spent about 392 hours a year in meetings, and roughly 1 in 10 employees logged more than 15 hours of meetings per week.
This metric is useful because it turns a vague complaint into a real pattern. If a team spends 12 to 15 hours a week in meetings, the issue is no longer perception. It is capacity.
2. Recurring meeting share
Recurring meetings are not automatically bad. In many teams, they are necessary. The problem is that they often stay on the calendar long after their original purpose has faded.
Tracking recurring meeting share helps you understand how much of the calendar is already committed before the week even starts. If most meeting hours come from recurring events, the workday becomes pre-spent. That leaves less room for focused execution and less flexibility when priorities change.
For a broader view of the org-wide signals behind overload, see our guide to meeting culture metrics.
Flowtrace found that 48% of all meetings were recurring. Those recurring meetings were shorter on average than one-off meetings, but their real cost comes from repetition over time.
A useful question here is not just “How many recurring meetings do we have?” It is “Which recurring meetings still justify their place every single week?”
3. Average meeting length
Meeting length is simple, but it tells you a lot.
Long meetings are not always inefficient, but they should earn their length. If a company defaults to 60-minute blocks for discussions that could be handled in 25 or 30 minutes, the cost compounds quickly.
Flowtrace’s recent meeting data found a median meeting duration of 35 minutes, and only 12% of meetings ran longer than an hour. That suggests many teams are already moving toward shorter, more focused sessions.
This is where a lot of companies miss the point. The goal is not to make every meeting shorter. The goal is to make meeting length deliberate. A short meeting with no purpose is still wasted time. A longer meeting with a clear decision to make may be justified.
4. Large-meeting rate
One of the fastest ways to raise meeting cost and lower participation is to overinvite.
Large meetings often exist because people want visibility, coverage, or safety. But once the room gets too big, discussion quality usually falls. Fewer people contribute. Accountability gets blurred. The meeting becomes more of a broadcast than a working session.
Flowtrace found that 64% of meetings had six or fewer participants, while only 8% had more than ten. That is a strong signal that smaller groups are often the healthier default.
This metric is worth tracking because oversized meetings rarely look broken on the surface. They still happen. People still attend. But the cost is higher, the discussion is flatter, and the outcome is often weaker.
5. Short-notice meeting rate
Some urgent meetings are necessary. Too many short-notice meetings usually signal reactive planning.
When meetings are constantly booked within a few hours of start time, calendars become unstable. Focus time disappears. People spend more of the day switching context instead of finishing work.
Flowtrace’s data found that 35% of meetings were scheduled within 24 hours of their start time, while only 8% were booked more than a week ahead.
This is one of the clearest indicators of meeting sprawl. A calendar full of late-booked meetings tells you the organization is coordinating in real time rather than working from a stable operating rhythm.
6. Meeting cost
Meeting cost makes the impact visible in financial terms.
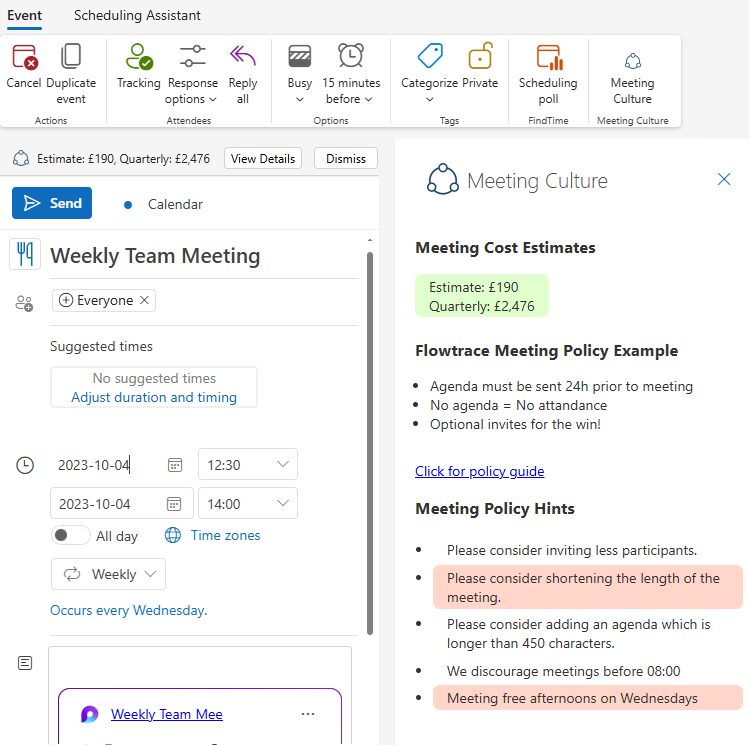
The formula is straightforward: multiply the number of attendees by the average hourly compensation of those attendees, then multiply that by the meeting duration. For recurring meetings, multiply again by frequency across the month or quarter.
This is not about making every meeting feel expensive for the sake of it. It is about helping teams understand tradeoffs. A weekly 60-minute meeting with eight mid-to-senior employees can carry a much larger cost than people assume.
Flowtrace’s own statistics also highlight how even small changes matter. Removing just two attendees from a 30-minute meeting saves the equivalent of one full-time employee day per 100 meetings.
Cost is especially helpful when trying to reduce bloated attendee lists or challenge recurring meetings that nobody wants to cancel.
7. Invite acceptance rate
Acceptance rate helps you understand how people respond to the meeting before it even happens.
If invite acceptance is consistently low, that can point to several problems. The timing may be poor. The attendee list may be too broad. The meeting may not feel relevant. Or the purpose may not be clear enough in the invite.
This is one of the most practical early-warning signals because it shows meeting quality before you get into the room. A weak acceptance pattern usually means the meeting was not designed tightly enough.
It also helps teams stop blaming “engagement” for what is really an invitation problem.
8. Attendance rate
Acceptance rate tells you what people said they would do. Attendance rate tells you what actually happened.
This matters because there is a difference between calendar intent and real participation. If people accept but regularly miss the meeting, that suggests the meeting is not high enough priority, the calendar is overloaded, or the session is not valuable enough to protect.
Attendance also helps you identify which meetings truly matter to the people invited. A healthy pattern is not necessarily 100% attendance across every session. It is consistent attendance where the meeting is important and selective attendance where optionality is intentional.
9. Optional attendee rate
This metric is underrated.
A high optional attendee rate can be useful when a meeting includes observers or people who only need occasional visibility. But it can also become a sign that organizers are unsure who really needs to be there.
Tracking optional attendee rate helps companies reduce decision drag. When half the room is optional, it often means the purpose of the meeting is too loose or the organizer is hedging.
This metric works best when paired with meeting size and acceptance patterns. Together, they show whether the invite list is focused or padded.
10. Agenda coverage rate
A meeting without an agenda is often just a placeholder for a conversation that has not been thought through.
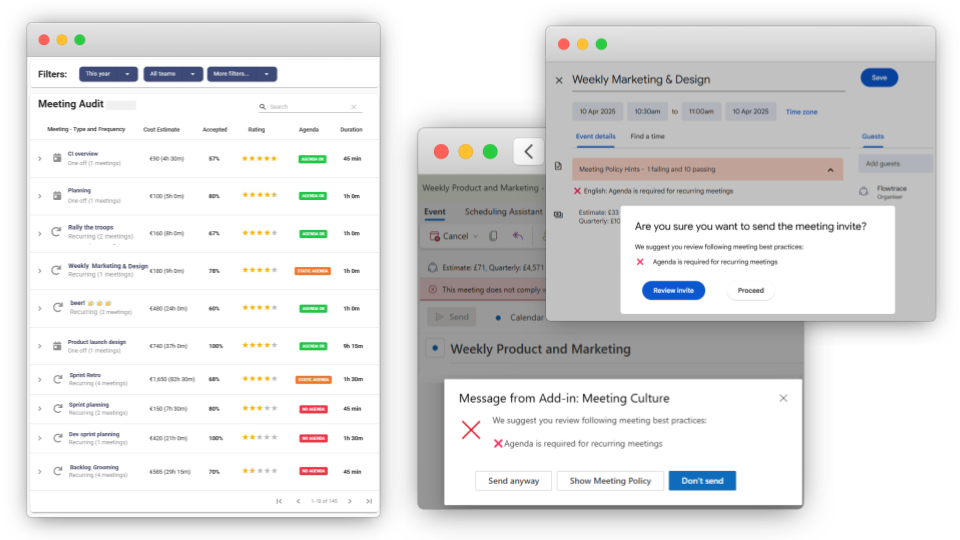
Agenda coverage rate measures how often meetings include enough structure before they begin. That does not mean every meeting needs a long brief. It means the purpose, core topics, and expected outcome should be visible to attendees in advance.
This is one of the clearest areas where Flowtrace’s findings are useful. The company found that 60% of one-off meetings lacked a structured agenda. In earlier data, recurring meetings also showed weak agenda discipline.
That is a strong sign that many calendar problems start before the meeting even begins. Better agenda discipline does not just improve the meeting. It improves whether the meeting should happen at all.
11. On-time start rate
Timeliness is a basic meeting hygiene metric, but it has outsized importance.
Late starts create waste immediately. If five people spend four minutes waiting, the meeting has already lost 20 minutes of collective time before anything useful happens. Across a company, those delays add up fast.
Flowtrace’s data found an average join lag of 24 seconds, and 84% of meetings started within the first minute. That is a healthy benchmark because it reflects meeting discipline, preparation, and working norms.
Track this metric by team and meeting type. Some late-start patterns are cultural. Others point to bad scheduling, overloaded calendars, or meetings placed too tightly back to back.
12. Planned vs actual duration
This is slightly different from average meeting length.
Planned vs actual duration measures whether meetings stay within the time they were given. A 30-minute meeting that regularly runs to 42 minutes is not a 30-minute meeting. It is a poorly scoped meeting.
This metric is useful because it reveals one of the most common calendar distortions. Teams think they are budgeting 30 minutes, but the real pattern is spillover. That pushes later meetings back, cuts into focus blocks, and makes the entire day feel fragmented.
When a meeting consistently overruns, there are usually only a few explanations: the agenda is too broad, the wrong people are in the room, the decision owner is unclear, or the meeting should have been split into separate sessions.
13. Participation balance
Good meetings do not require equal airtime from every person, but they should not rely on one or two voices doing all the work.
Participation balance measures whether a discussion is distributed enough for the meeting type. In brainstorming or decision meetings, extreme concentration of airtime can be a warning sign. It may mean the meeting is too large, facilitation is weak, or some attendees should not have been invited.
Current best-practice guides on meeting analytics also treat participation and inclusion as meaningful performance signals, especially in larger meetings.
For most teams, this is less about policing who speaks and more about checking whether the meeting format actually supports contribution from the people who matter.
14. Decision rate
A meeting should create one of a few clear outcomes: a decision, a plan, an alignment point, or a next step.
Decision rate measures how often a meeting ends with an actual decision rather than just discussion. This is one of the most valuable outcome metrics because it forces teams to separate conversation from progress.
Not every meeting needs a big decision. But if leadership reviews, project syncs, and planning sessions repeatedly end without decisions, the meeting is likely serving as a holding pattern rather than a working mechanism.
This metric is especially useful for recurring meetings. A recurring meeting with no meaningful decision output over several cycles is a strong candidate for redesign or removal.
15. Action item completion rate
This is the clearest downstream measure of whether meetings lead to execution.
Action item completion rate tracks how many agreed next steps are completed by the target date or by the next meeting. It is a strong signal because it tests whether the meeting produced real ownership and whether the follow-through system is working.
Current KPI guides also treat assigned actions and completed actions as core meeting success measures.
If a meeting generates lots of action items but completion stays low, the problem may not be motivation. It may be that the meeting created vague ownership, unrealistic commitments, or too many follow-ups at once.
How to Use These Meeting Metrics
A common mistake is trying to track everything at once.
Most companies do better when they start with a smaller operating set, then expand only when the data reveals a specific problem. In practice, that usually means starting with:
- Total meeting hours
- Recurring meeting share
- Meeting cost
- Agenda coverage
- On-time start rate
- Action item completion rate
That gives you a mix of load, structure, discipline, and outcomes.
From there, you can add deeper metrics such as participation balance, optional attendee rate, or short-notice scheduling if the organization is clearly struggling with bloat, fragmentation, or weak follow-through.
At Flowtrace, this is where the data becomes useful. You are not measuring meetings for reporting. You are measuring them so you can make better decisions:
- Which meetings to shorten
- Which ones to cancel
- Which ones need fewer people
- Which ones need better agendas
- Which ones are not producing decisions or action
That is the point of meeting metrics. Not more reporting. Better meeting design.
Final thoughts
Most companies do not need more meetings. They need better signals on the meetings they already have.
The strongest meeting cultures are not built by guesswork. They are built by measuring what is happening, spotting where the waste sits, and changing the design of meetings over time.
Flowtrace’s own data points to the same conclusion. Modern meetings are getting shorter and smaller in many teams, but problems still show up in agenda quality, short-notice scheduling, and overloaded calendars.
If you track the right meeting metrics, you can stop treating meetings as a fixed cost of collaboration. You can start treating them as a performance system that can be improved.
That is when meetings stop draining time and start earning it.