Meeting Analytics
Meeting Analytics Guide: Metrics, Governance, and Improvement
Learn what meeting analytics is, which metrics matter, and how leaders use meeting data to improve meeting culture.
Learn how to measure meeting cost, diagnose cost drivers, benchmark meeting patterns and reduce avoidable costs without damaging coordination.
We have yet to see a company with a real meeting budget.
Travel is budgeted. Software is budgeted. Contractors are budgeted. Meetings usually disappear inside payroll, even when the calendar has committed a large share of the company's paid capacity before anyone starts the work discussed in those meetings.
In our client work, the gross labor-cost equivalent of scheduled meetings can land at roughly 25% to 35% of payroll. That is an operating observation, not a universal benchmark. Meeting load, salary assumptions, attendance rules and organizational structure can move the result substantially. The number is still large enough to deserve the same management discipline as other operating costs.
Meeting cost is the financial and operating value committed to organizing, attending and following up on meetings. A cost estimate prices that commitment. Meeting cost management goes further: it shows where the cost comes from, whether the meeting earns the investment and what should change.

Meeting cost answers a deceptively simple question: what has the organization committed because this meeting exists?
The answer includes more than the room booking or video platform. A meeting can commit attendee time, preparation, follow-up, travel, technology, coordination effort and space in the working day that might otherwise support focused work. Some of those costs can be calculated directly. Others should be tracked as operating signals rather than forced into a speculative currency value.
That distinction matters because three terms are often mixed together:
| Term | What it means | The decision it supports |
|---|---|---|
| Meeting cost | The value committed to a meeting or meeting portfolio | Where is organizational capacity being allocated? |
| Meeting waste | The avoidable part of that commitment | Could the same outcome be achieved with less time, fewer people or another method? |
| Meeting value | The result the meeting helps produce | Did the meeting improve a decision, unblock work, reduce risk or strengthen necessary coordination? |
A high-cost meeting is not necessarily a bad meeting. A board decision, customer workshop or incident response can justifiably involve expensive people. A low-cost weekly status meeting can be poor value when it repeats for a year without changing a decision.
This is why the Guide starts with management rather than arithmetic. If you need the full salary-loaded formula, assumptions, worked example and budgeting method, use Company Meeting Costs: How to Calculate and Budget Them. If you need a number for one meeting now, use the interactive Meeting Cost Calculator.
We have learned that most people understand the human meaning of hours but do not connect those hours with business cost until they see the same commitment in currency. Petri estimates this is true for roughly nine in ten people encountered in client work. It is an observation, not a survey result.
That is why Flowtrace shows both views. Time keeps the discussion connected to workload and capacity. Currency gives finance, operations and leadership a familiar unit for comparing meeting choices with other business decisions. Neither view should pretend an estimate is exact to the last pound, dollar or euro.
Two companies can track the same meeting hours, costs and agenda signals and get completely different results. One looks at a dashboard once. The other uses the information to change what people schedule next week.
The Organizational Meeting Maturity Model describes four stages: Chaos, Formalizing, Measuring and Active Change. In this Guide, we call the first stage Reactive. The meaning is the same, but the word describes the operating state without suggesting that the client organization itself is chaotic.
| Stage | How meeting cost appears | What to measure now | What should happen next |
|---|---|---|---|
| 1. Reactive | Meeting time feels free. Recurring meetings persist, invitations grow and nobody owns the total commitment. | Total meeting hours, meeting count and a rough attendee-weighted estimate. | Make the allocation visible, choose one problem area and create shared urgency. |
| 2. Formalizing | Guidelines exist and cost awareness appears in reviews, but adoption depends on individual managers. | Calendar saturation, recurring share, team-level time and cost estimates, employee feedback. | Agree calculation assumptions, assign ownership and review recurring commitments consistently. |
| 3. Measuring | Meeting cost becomes an organization-wide diagnostic. Leaders can compare patterns and locate the drivers behind the total. | Attendee-weighted cost, cost by team and meeting type, recurrence, large-meeting contribution, lateness and before/after baselines. | Run bounded changes against hotspots and measure the result. |
| 4. Active Change | Cost and meeting rules influence the invite while it is still being created. Avoidable cost is prevented instead of reported later. | Level 3 measures plus rule adoption, scheduling behavior, released capacity, avoided future cost and unintended effects. | Replace reminders with useful defaults, tune the rules and keep verifying impact. |
The stages are not a scorecard for judging your teams. They help a company choose the next sensible capability. A Reactive organization does not need twenty executive metrics. It needs a trusted baseline. A Measuring organization does not need another dashboard if nobody can change the scheduling decision. It needs a clear operating loop and action at the point the invite is created.
The maturity model tells you where the organization is. The next sections tell you what the cost consists of and where to look.
There is no single perfect number called “the true cost of meetings.” There is a set of related costs, each useful for a different decision.
Travel, catering, venue hire, accommodation, equipment and event fees are ordinary cash expenses. They belong in a meeting or event budget because the cash leaves the business.
Attendee time multiplied by a consistent hourly employment cost gives the labor-cost equivalent of the meeting. This is usually the largest visible component and the one most calculators estimate.
It answers where paid capacity was allocated. It does not prove that the allocation was wasted or that cancelling the meeting would reduce payroll.
Scheduling, preparation, rescheduling, context gathering, note distribution and follow-up can add work outside the booked slot. The overhead cost of meetings is worth tracking separately because its remedies differ from shortening the meeting itself. It also includes the type of meeting cost we all know, pre-meeting preparation meeting.
Meetings can divide the day into gaps that are too short for demanding work. They can also require time to recover and return to an interrupted task. Research by Zhang, Spreitzer and Qiu used two experience-sampling studies and found that a greater proportion of time in meetings relative to individual work was associated with fewer replenishing microbreaks, which in turn harmed energy.
A separate study by Allen, Thiese, Eden and Knowles found that meeting satisfaction, effectiveness and relevance were related to the recovery people needed after workplace meetings. These studies support the mechanism. They do not justify adding a universal “recovery tax” to every meeting.
Use calendar analytics to inspect fragmented days, back-to-back meetings and missing focus blocks without pretending every effect can be converted into precise currency.
A meeting can create rework, slow a decision or require another meeting because the purpose, decision rights or follow-up were unclear. This is often the most important business effect and the hardest to price honestly.
Track the observable outcome first: repeated decision meetings, time to decision, unresolved actions, follow-up meetings or delayed delivery. Only attach a financial value when the business has a defensible method for doing so.
For deeper treatment of costs beyond attendee time, read Indirect Costs of Meetings. For the internal collaboration angle, see The Cost of Internal Meetings.
Meeting cost compounds. Duration, attendance and recurrence multiply each other, while role mix, lateness, preparation and calendar placement change the surrounding demand.
In Flowtrace's 2026 meeting statistics, based on 1,240,880 scheduled meetings from 2025, 48.5% of meetings were recurring. Among recurring meetings, 33.0% had seven or more invitees. That is why an ordinary-looking calendar decision can become a material annual commitment.
Use this diagnostic map to decide what to investigate:
| Cost driver | Useful signal | Question to ask before acting |
|---|---|---|
| Volume | Meetings and meeting hours by team, role and week | Is the volume temporary, role-dependent or built into the operating model? |
| Duration | Cost and frequency by scheduled length | Does the purpose earn the slot, or has the calendar default become the plan? |
| Attendee count | Attendee-weighted hours and large-meeting contribution | Who must decide, contribute or be informed? Do all of them need to attend? |
| Recurrence | Annualized recurring hours/cost and series age | Does the original purpose still exist? When was the series last reviewed? |
| Role and salary mix | Cost by role band or organizational layer | Are expensive decision makers attending because decision rights are unclear? |
| Lateness and overruns | Waiting minutes, overrun minutes and their attendee-weighted cost | Is the problem punctuality, setup, agenda design or overloaded scheduling? |
| Preparation and follow-up | Work outside the slot, repeated actions and follow-up meetings | Is the meeting reducing coordination work or creating more of it? |
| Calendar placement | Fragmented days, short gaps and back-to-back runs | Does the schedule leave usable time for the work the meeting creates? |
| Purpose and outcome | Meeting type, agenda/purpose signal, decision or output | Is the meeting expensive, or is it expensive without a clear result? |
Duration deserves care because it is easy to measure and easy to misread. In the same Flowtrace dataset, 44.9% of meetings were scheduled for 30 minutes and 18.9% for 60 minutes. Those are observed defaults, not recommended lengths. A difficult decision may need 60 minutes. A routine update may be wasting half of a 30-minute slot.
The same caution applies to teams. Sales, recruiting, customer delivery, engineering and leadership coordinate differently. A high-cost team is a place to ask better questions, not proof of poor performance. Our article on meeting cost per employee explains how normalization helps and where it misleads.
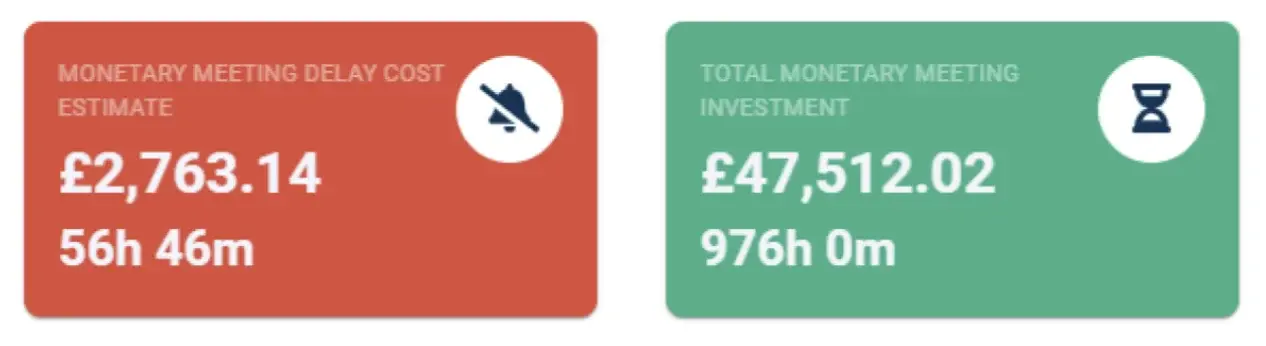
Late starts are a good example of a narrow driver with its own remedy. Read how to measure the cost of late meetings rather than hiding punctuality inside a generic cost total.
Companies often ask whether their meeting cost is good or bad before they have a stable way to measure it.
There is no universal meeting-cost benchmark that works across operating models. Consulting and customer-success teams spend time with clients. Recruiters have interviews and candidate debriefs. Product teams need decisions across specialties. International companies concentrate meetings into limited overlap windows. One flat target turns those differences into noise.
Build the baseline in this order:
Use benchmarks in this order:
External data is useful for forming questions. It is rarely a verdict. Flowtrace works with approximately 200 client accounts, mostly knowledge-work organizations, and that experience gives us a sense for patterns that deserve investigation. We sometimes call them “smells.” A recurring executive meeting with a growing audience may smell expensive. A team with no usable focus blocks may smell overloaded. A few probing questions can tell us whether there is something to investigate.
The smell is not the benchmark. It is the reason to look deeper.
This is also where maturity matters. A company at the Formalizing stage should value a consistent baseline over theoretical precision. A company at the Measuring stage can add segmentation, confidence ranges, exceptions and before/after comparisons.
A cost dashboard becomes useful when it changes a decision and measures the result. The operating loop is straightforward:
Establish meeting hours, attendee-weighted cost and direct expenses using transparent assumptions. Keep the initial model simple enough that finance, operations and managers can explain it.
Move beyond the company total. Segment by team, meeting type, recurrence, attendee count, organizer, duration, day pattern and relevant role bands. Meeting Cost Tracking explains the organization-wide diagnostic process in more detail.
Do not choose the most expensive meeting automatically. Look for combinations of material cost, weak purpose, repeated friction and a change the organization can realistically test.
Remove the meeting, replace the information transfer, shorten the slot, reduce the audience, reset the recurrence, clarify the decision or introduce a scheduling rule. One bounded intervention is easier to interpret than a company-wide campaign with ten simultaneous changes.
Compare the new period with the baseline. Check meeting cost, behavior adoption and counter-metrics such as decision delay, rework, employee feedback and focus time. If the number falls while coordination gets worse, the intervention failed.
“We saved £500,000 in meetings” often means “we reduced the labor-cost equivalent of scheduled meeting time by £500,000.” Those are not the same claim.
| Result type | What changed | Honest reporting language |
|---|---|---|
| Released capacity | Employees have more time for other work | “The change released an estimated 4,000 hours of employee capacity.” |
| Avoided future cost | New or renewed commitments were prevented | “Scheduling changes avoided an estimated £X in future annualized meeting commitment.” |
| Direct cash saving | Travel, venue, overtime, contractors or another expense fell | “The intervention reduced direct spend by £X.” |
| Operating gain | Delivery, decisions, quality or customer work improved | Report the measured business outcome separately from the meeting-cost estimate. |
Released capacity is valuable. It just needs to be named correctly. The business case becomes stronger when leaders can show where that capacity went and whether the work improved.
The target is not the smallest possible calendar. The target is to spend meeting capacity deliberately.
Research on organizational meeting orientation found that perceived meeting overuse was negatively associated with meeting satisfaction and effectiveness, while strategic use was positively associated. The research is correlational, but the management lesson is useful: meeting volume and meeting purpose must be considered together.
Choose the intervention that matches the driver:
| Decision | Use it when | Protect against |
|---|---|---|
| Remove | The purpose has expired or no useful output is produced | Losing a necessary decision or escalation path |
| Replace | The meeting only distributes information or gathers simple updates | Moving the same burden into noisy messages and documents |
| Shorten | The purpose is sound but the calendar default exceeds the work | Rushing a decision that genuinely needs discussion |
| Shrink | People attend for visibility rather than contribution | Excluding people from context they still need |
| Reset recurrence | A useful meeting repeats more often than the work requires | Allowing important issues to wait too long |
| Redesign | The meeting matters but preparation, roles or follow-up create repeat work | Treating facilitation as a substitute for fixing the operating problem |
| Govern while scheduling | The organization knows the rule but people forget it when creating invites | Rigid rules that ignore legitimate exceptions |
Start with recurring commitments and large outliers because the effects compound. Then inspect delays, meeting-heavy days, unclear decision rights and status meetings that can move to another format.
Use the broader meeting cost reduction strategy when you need an organizational program. Use the eight-step meeting cost checklist when managers need a practical sequence. Use the Meeting Policy Guide when the problem is adoption, ownership and calendar-side rules.
The same meeting-cost dashboard should not lead every role to the same conversation.
Ask where meeting capacity supports strategy and where it has become an unexamined operating commitment. Review the company trend, recurring portfolio, large meetings, decision forums and verified outcomes. Avoid turning the board discussion into a leaderboard of teams.
Validate cost bands, loaded-cost assumptions, currency and reporting language. Separate direct spend, labor-cost equivalent, released capacity and cash savings. Finance gives the model credibility by preventing an estimate from becoming an exaggerated savings claim.
Own the management loop. Define review cadence, meeting-type taxonomy, exceptions, target areas and counter-metrics. Operations is often best placed to connect meeting patterns with the company's operating rhythm.
Connect employee feedback with observable calendar patterns without blaming individuals. Protect privacy, explain how the data is used and watch whether changes improve workload and meeting experience. Meeting analytics should support employees, not monitor them.
Own data access, cost configuration, calendar integration, privacy boundaries and administration. IT also helps move the organization from policy documents to useful Google Calendar or Outlook prompts.
Review team patterns in context. Decide which meetings to remove, replace, shorten, shrink or redesign. Managers should receive a small number of actionable signals, not a wall of corporate metrics.
Different tools solve different maturity problems.
| Capability | Best use | Limitation on its own |
|---|---|---|
| Manual calculator | Price one meeting or test an assumption | Cannot reveal recurrence, team patterns or behavior over time |
| Calendar-side cost display | Make cost visible while scheduling | Visibility alone may not explain the organization-wide driver |
| Organization-wide meeting analytics | Build baselines, segment cost and find hotspots | A dashboard does not automatically change the next invite |
| Policy and scheduling rules | Remind or guide organizers at the decision point | Rules need evidence, exceptions and ownership |
| Impact tracking | Verify behavior, capacity and counter-metrics | Requires a trusted baseline and consistent definitions |
The useful system connects these capabilities. Analytics reveals where the cost comes from. Calendar-side guidance changes the behavior that creates it. Analytics then shows whether the change held.
Flowtrace uses calendar and meeting metadata to measure meeting load, recurrence, attendee patterns, cost, delay and organizational trends. It does not need to record, transcribe or interpret meeting conversations. Leaders can use Flowtrace Meeting Analytics to move from a company total into the patterns behind it.
At the Active Change stage, cost visibility and meeting rules appear inside the scheduling workflow. Flowtrace supports meeting cost visibility in Google Calendar and meeting cost visibility in Outlook, where the organizer can still change the attendee list, duration, recurrence or meeting purpose.
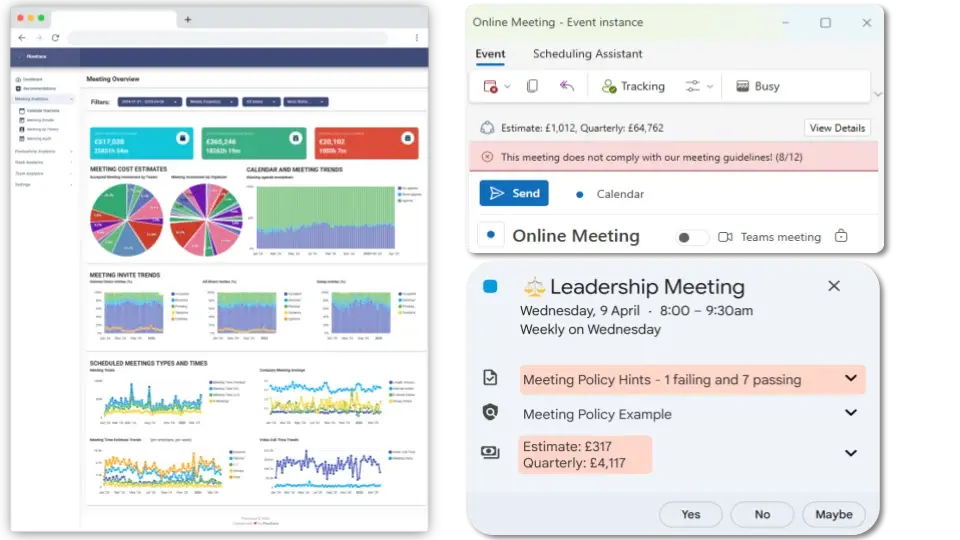
From January through June 2026, Flowtrace calendar extensions displayed meeting-cost estimates 11,073,171 times. These were display events, not unique meetings, because the same calendar event can be opened more than once. The scale matters because it gives us repeated exposure to the point where a meeting can still be changed.
For a category comparison, see the best meeting cost tools in 2026. For platform-specific implementation, use Meeting Costs for Google Calendar, Add Meeting Costs to Outlook or the cross-platform Meeting Cost Plugins guide.
Use the route that matches the decision in front of you.
Meeting cost is the financial and operating value committed to organizing, attending and following up on meetings. It includes direct expenses, the labor-cost equivalent of attendee time and operational effects such as preparation, delay and fragmented work.
No. Useful meetings consume paid capacity too. Meeting cost shows where the organization commits time and money. Waste exists when the same outcome could be achieved with less time, fewer people or a different method.
Multiply each attendee's loaded hourly cost by the meeting duration, add the attendee results and include any direct expenses. Apply the same salary, attendance and time assumptions consistently. The full method is in Company Meeting Costs.
Usually it releases employee capacity rather than reducing payroll. It becomes a cash saving only when the change affects overtime, contractor spend, hiring plans, travel, facilities or another actual expense.
The most useful benchmark is the organization's own stable baseline, segmented by comparable teams, meeting types and roles. External figures provide context, but organization design and coordination needs make one universal target unreliable.
No. Flowtrace has observed that gross labor-cost equivalent range in meeting-heavy client organizations, but it is not a universal benchmark. Meeting-time share, salary assumptions, attendance data and organizational structure change the result.
Not necessarily. Role or team cost bands are often accurate enough for management decisions and reduce unnecessary exposure of individual pay data. The important requirement is consistent, documented assumptions.
Executive or operations leadership should own the company-level outcome. Finance should validate cost assumptions, People teams should protect employee trust, IT should govern calendar tooling, and managers should act on team-level patterns.
The first estimate will get attention. That is useful, but it is not the work.
Build a baseline people trust. Find the pattern behind the number. Change one scheduling or management decision. Check the cost, the behavior and the outcome. Then repeat.
If the company remains dependent on managers reminding people to invite fewer attendees or review recurring meetings, it is still Formalizing. Active Change begins when the system makes the better choice easier while the meeting is being created, and the organization can prove whether that choice worked.
Learn what meeting analytics is, which metrics matter, and how leaders use meeting data to improve meeting culture.
Learn how to create a meeting policy, set meeting rules, govern calendars, and use analytics to make better meeting habits stick.
Learn how calendar analytics measures meeting load, focus time and schedule fragmentation, and how leaders turn calendar patterns into action.